Bitcoin Market update; Positive CPI data – What next?
A lot has occurred since our last update, so let’s start at the top; reviewing where we are from high timeframe technicals, through to the lower timeframes and we’ll try to keep it all within context of the macro & geopolitical climate and the Bitcoin cycle.
Higher Timeframes;
The weekly chart for Bitcoin is very clean, support found at previous all time highs, having broken down from an epic 70 week distribution, both levels setting the goal posts of support and resistance on a macro level at their respective levels around $20k and $30k in round numbers.

BTCUSD 1 Week Chart Support & Resistance
https://www.tradingview.com/x/8UZbv1CV/
The 3 day chart below (with the Predator indicator overlay) shows Bitcoin continuing to show green candles and has done so since 15th July at $20k, helping us to position to the longside before the recent circa 20% move up.

BTCUSD 3 Day Chart with Predator overlay
https://www.tradingview.com/x/lspxPFIQ/
Also shown on the chart is the 20 Week Moving Average (WMA) and the deviation from that WMA, as red and green bands. Bitcoin fell into the deviation bands around the 200 WMA as we have seen previously and highlighted below.

BTCUSD 1 Week Chart 20 WMA & Deviations
https://www.tradingview.com/x/vRDJECvu/
What is notable is that in each of the previous examples (and back in the previous cycle) the dump into the deviation bands is followed sooner or later by meeting the 20 WMA. A break back above the 20 WMA resulted in an effective confirmation of the downtrend being over and also came with an explosive move.
Bitcoin was following a high correlation with legacy markets as shown below with the S&P500 in white and NASDAQ in blue, however since reaching the most recent bottom, all of the downside on the legacy markets has been regained and Bitcoin has failed to follow suit.

BTCUSD, NASDAQ and S&P Correlation
https://www.tradingview.com/x/SyA8wbIe/
Had Bitcoin seen a similar bounce, we would have Bitcoin trading north of $30k, however this has not occurred, most likely due to the extent of unwinding the forced liquidations following the collapse of Luna, Celsius, 3AC and everyone else that got caught up in the storm having failed to see the downside risk, all of which has resulted in a loss of willing bidders within an obvious risk off period brought about by inflation and economic slowdown.
What has not changed, is Bitcoin’s propensity to be at the mercy of the Fed’s policy to combat the inflation. Better than anticipated inflation data on Wednesday being the most recent example, which let Bitcoin take a leap north, alongside equities.
Moving forwards, the CPI data and following monetary policy decisions are going to continue to be paramount in determining what happens next. Indeed, what happens next will be with the backdrop of; The geopolitical situation with the Russia-Ukraine conflict, Europe’s looming winter energy crisis & economic slowdown and China’s policy with Taiwan, Covid lockdowns and their leveraged real estate sector just to mention a few.
In summary, things remain on a bit of a knife edge to say the least. The CPI data was promising and was generally seen to be a sign that the quantitative tightening and rate hikes are working. However, it is extremely early days, particularly going into the winter period, where the Europeans are going to face astronomically high energy costs on top of the inflation that already exists, which remains a risk for the US economy to catch a cold from the EU and stifling growth further, and this is only cherry picking one of several risks to work with.
Important Dates
Key dates forthcoming, are CPI data and FOMC meetings in the remainder of the year, the midterm elections (which usually see a rally after; median of +8% in Q4), and 1000 days since the previous Bitcoin halving, which has typically been where the end of the bear market occurs.
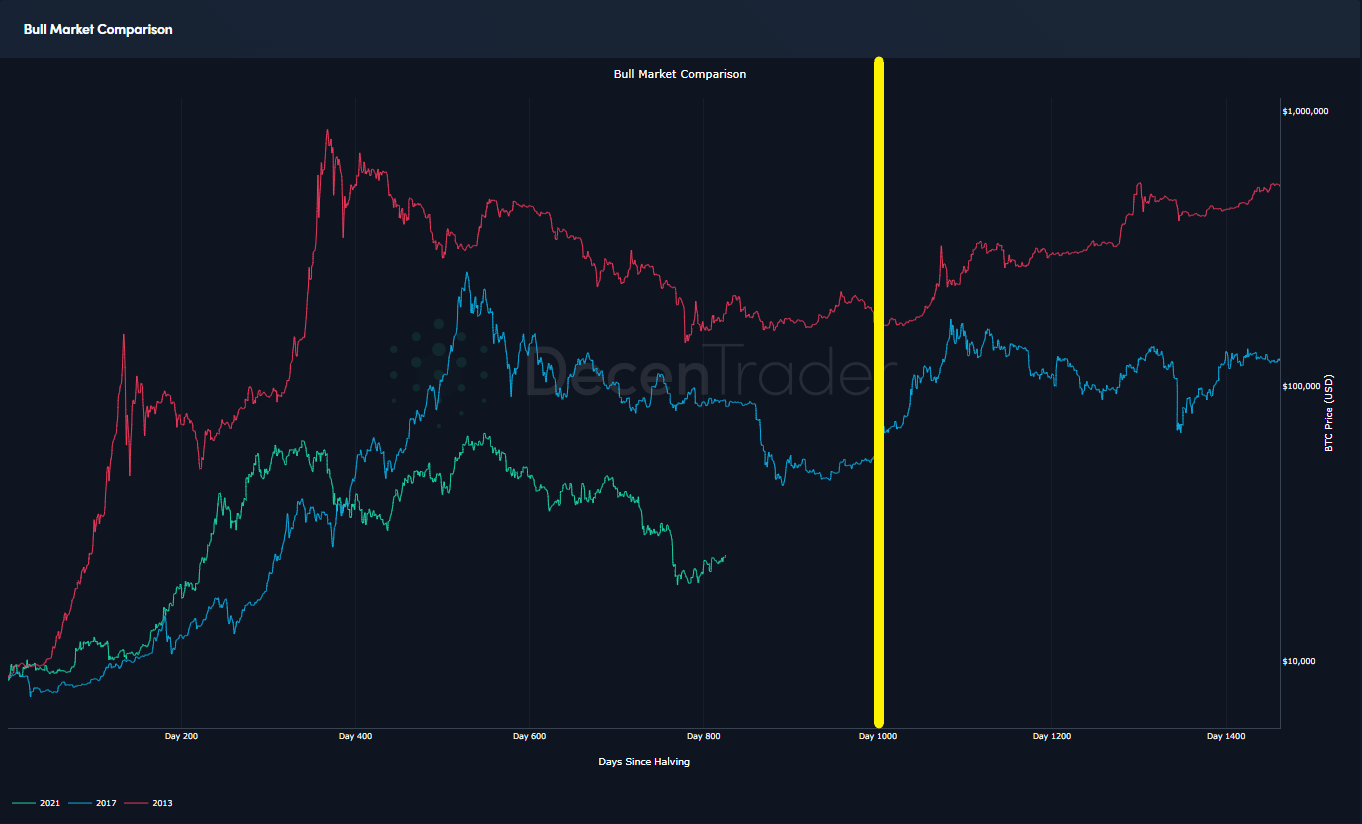
Bitcoin Market Cycle comparison
https://www.decentrader.com/charts/bull-market-comparison/
The dates referenced are shown on the below chart, but you can also track these dates along with other important crypto related dates on our calendar.

BTCUSD 1 Day Chart with Key Dates
https://www.tradingview.com/x/CvAPFRnh/
What you will note from the above chart, is that Bitcoin is currently in an uptrend towards the critical 20 WMA with the two likely to meet around the CPI data next month, if the current trajectory continues. Let’s unpack this situation more.
Lower Timeframe Analysis
The below chart looks at the 4 hour timeframe, but also includes the Decentrader liquidity tool indicator showing liquidity risk and the inclusion of the Key support and resistance level of $22.5k, the 200 WMA and 50 DMA.

BTCUSD 4 Hour Chart with Predator overlay and Liquidation Zones
https://www.tradingview.com/x/5yburMqL/
The 200 WMA and Key S/R levels are almost one and the same thing, having seen the 200 WMA act as resistance until August, where we have seen support and a bounce on the CPI data. The 50 DMA is now closely hugging the bottom of the uptrend and will soon start to converge with the 200 WMA if things remain constant.
The 10x liquidity levels also paint an important picture, with the short liquidations stacked to 26.5k, which is also defining the top of the uptrend and is also due to intersect with the 20 WMA if the trend continues.
Below the 50 DMA and 200 WMAs and the key S/R levels, is a significant amount of liquidity built up from longs during the uptrend. The long liquidations are specifically grouped between 22k down to 20.5k, where there is implied support before a big block below $19k all the way down to $17.4k.
Therefore, it paints quite a simple picture; Bitcoin is within the uptrend, supported by the 200 and 50 and previous S/R, on a clear path to ask some serious questions at the 20 week moving average. Prices below support are very likely to see price ask some hard questions around the 20k support level again.
Overall, a relatively quiet 4 weeks or so with no surprises would likely see continuation of sentiment driving towards the 20 WMA, where we know that a breakout with positive CPI data AND the Fed signalling more doveish would most likely send Bitcoin higher off towards the bottom of the previous macro range up around $30k. Cycle history would dictate that a break of this level would be unlikely until Q1 2023
However, bad CPI data or some other curveball from one of the other risks outlined, and Bitcoin will most likely quickly be below the 200 WMA, on a one way liquidation trip.
Shorter term
Lower timeframes have been relatively easy to predict. It’s generally useful to find the timeframe which works with the volatility we have to work with. The 1 hour and 6 hour timeframes have been particularly useful in identifying potential breakouts and breakdowns alongside the context of trade location for confluence.

BTCUSD 1 Hour Chart with Predator overlay
https://www.tradingview.com/x/JM3n1Hab/
Alongside the use of technical indicators like Predator, we specifically look at the relationship between funding rates, open interest and the long/short ratio, which has helped identify what the herd are doing who are invariably wrong. We have devised an indicator known as FOILS which is free to use and can be accessed here:
https://www.decentrader.com/funding-open-interest-and-long-short-ratios-foils/
Conclusion
The next CPI data and FOMC meeting is going to be critical in the short term, we discussed how this might impact Q4, but ultimately there are a plethora of systematic risks on the table which cannot be ignored – Bitcoin and Crypto won’t be facing these alone and will continue to generally follow the equity market.
We discussed the liquidity above and below and how price will react if that is tapped into. Look out for bad news having no downside impact on price as this is often a good sign the bottom is in. Persistent weeks of upside grind concluding 1000 days from the previous halving date is how both of the previous bear markets ended and I expect this to be no different. While the 3 day remains a positive outlook on Predator, we remain bullish.
Finally – Decentrader is currently offering a 7 day Free Trial of our premium product which gives access to all our analytical tools and dashboards on our site, as well as all our tradingview indicators, discord and livestreams. Just click the banner at the top of the page or click here.
Enjoy.
filbfilb / Decentrader
Disclaimer: Nothing within this article should be misconstrued as financial advice. The financial techniques described herein are for educational purposes only. Any financial positions you take on the market are at your own risk and own reward. If you need financial advice or further advice in general, it is recommended that you identify a relevantly qualified individual in your Jurisdiction who can advise you accordingly.


