Bitcoin – the narrative turns Bullish…
It has been a long, cold winter for Bitcoin and crypto. However, recent events have helped to catapult near-term price, and importantly have shifted the narrative from bearish to bullish.
Let’s take a look at why that has happened and what it means for Bitcoin going forwards.
Higher timeframe view
On the weekly chart, price reclaimed weekly support level A at the start of the year, which had become resistance after the FTX exchange blow up. Since 2023 kicked off though Bitcoin has been on a tear as the fears of wider economic impact on Bitcoin were recognised as being overblown. Predator remains green, as it has been since the start of the year, indicating that the longer-term trend remains to the upside for now.
Next upside weekly resistance is at $30k. If that holds then we may well start to see interest return from outside of the space and more mainstream media attention turns at least to neutral rather than negative.
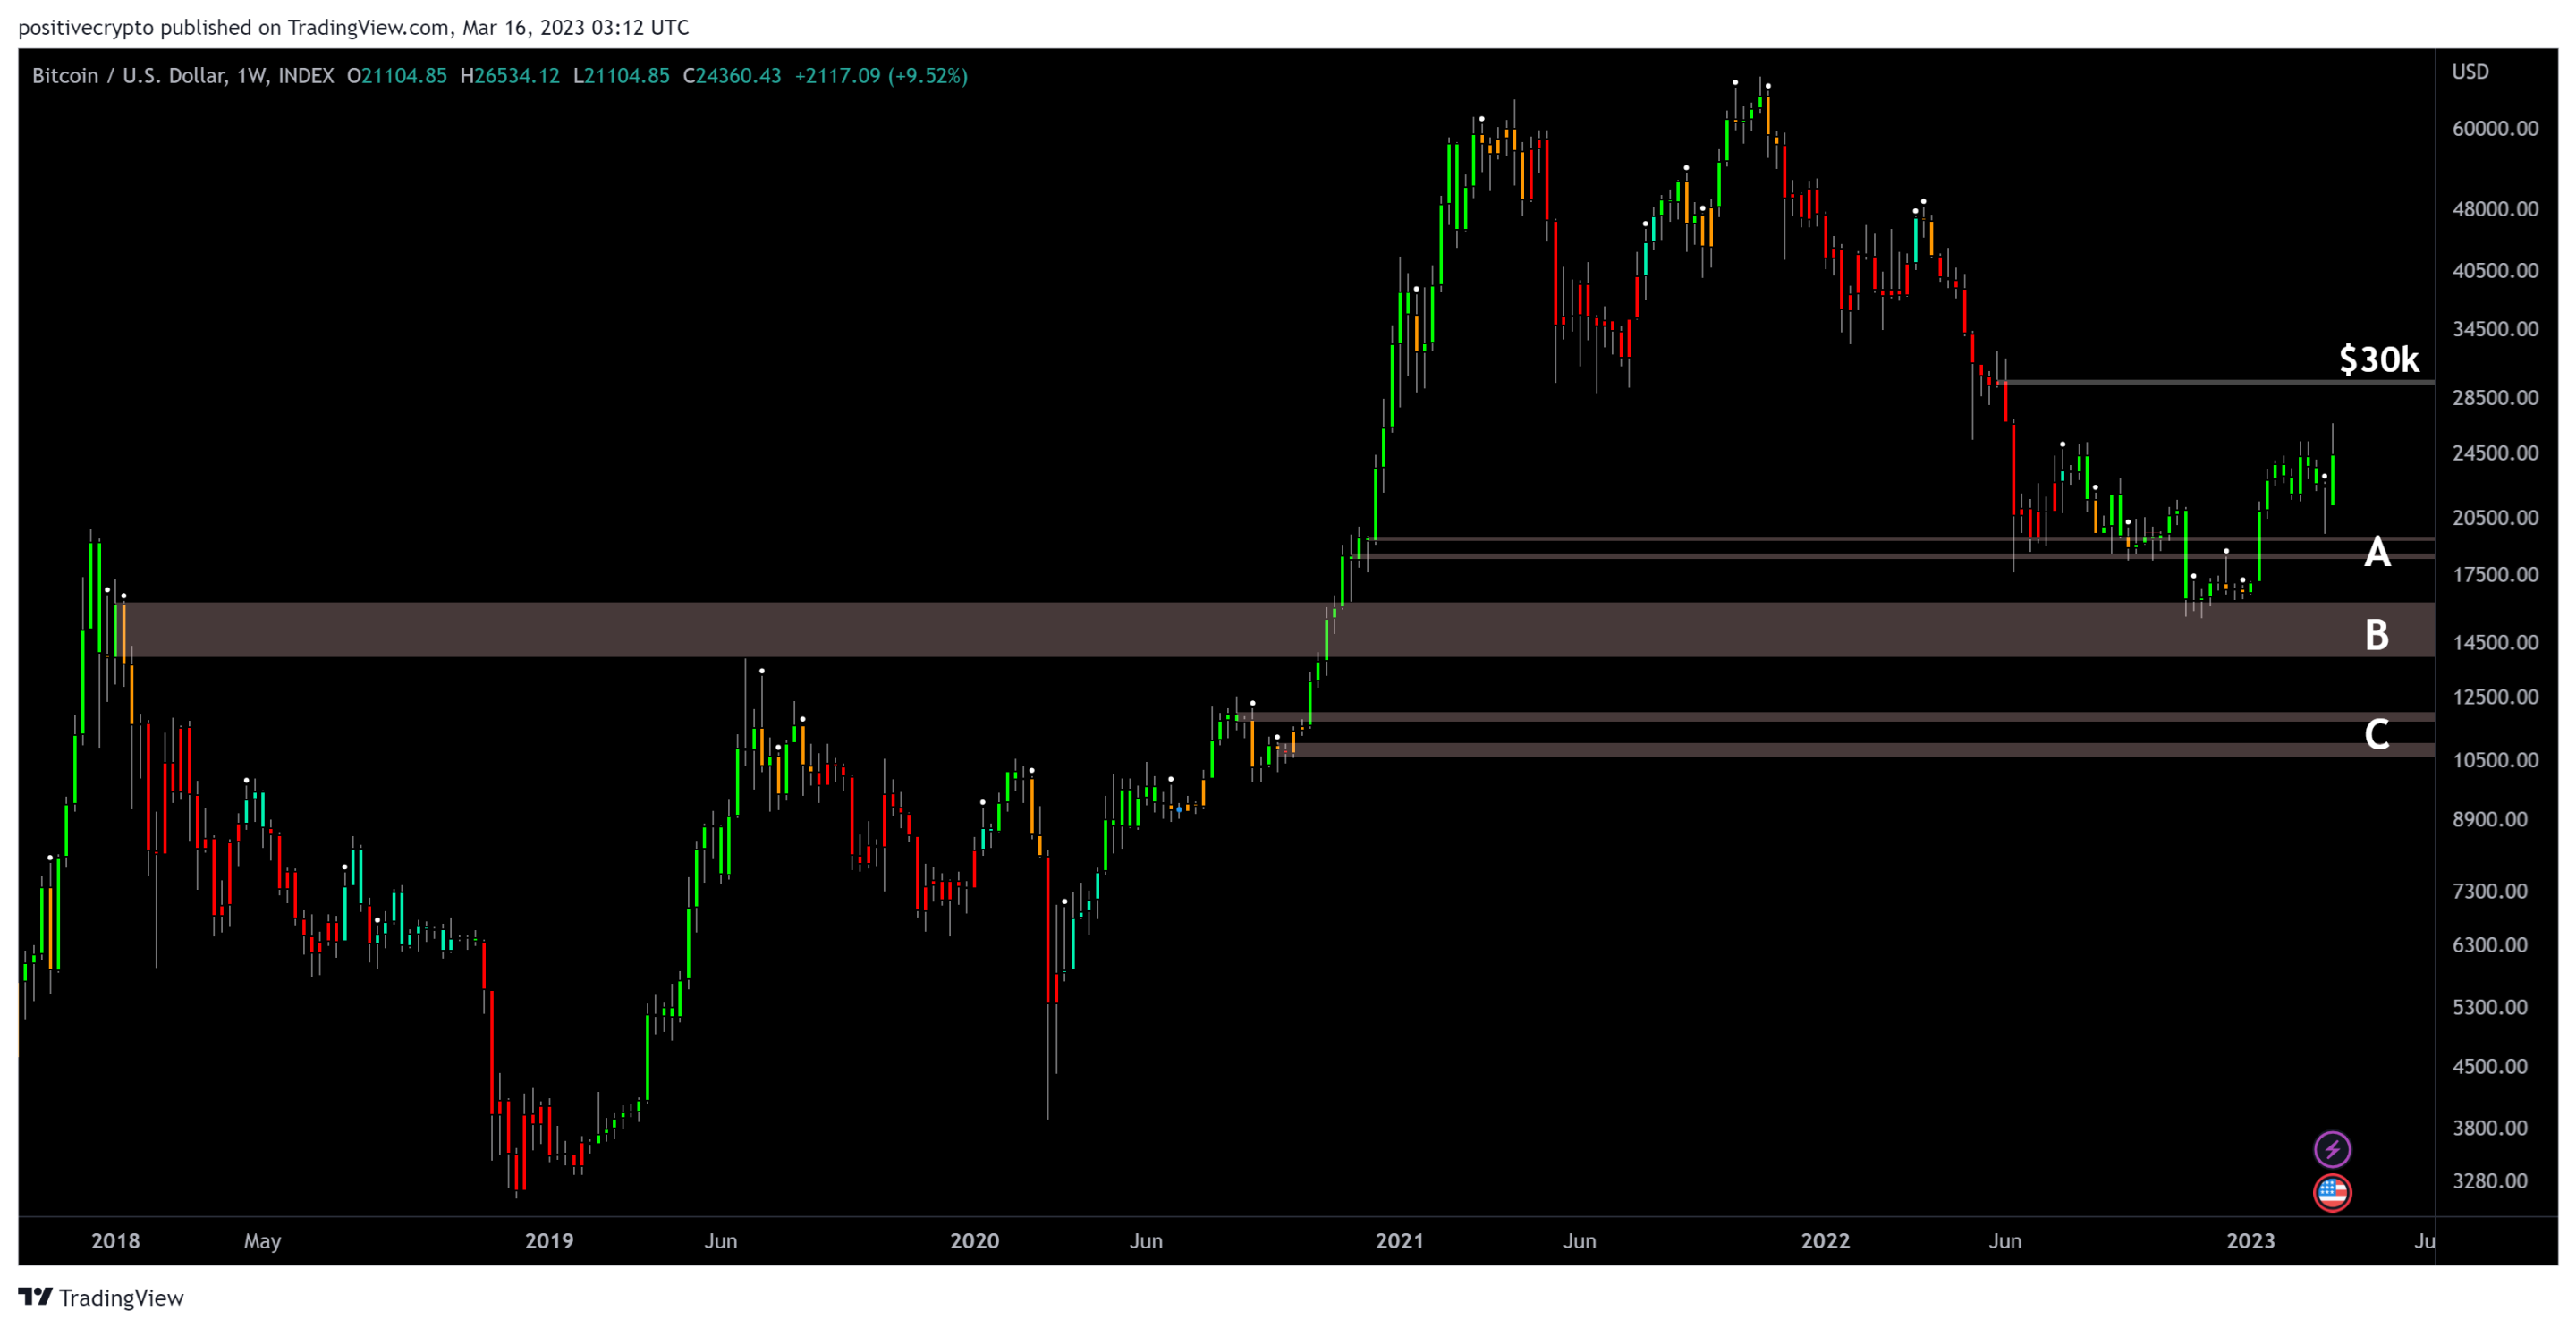 BTCUSD weekly chart with support and resistance.
In terms of the broader market cycle, this bear market looks broadly similar to previous ones in terms of shape and timing.
With the next halving event estimated to be 395 days from now, around 8 April 2024, we are now likely entering the very early bull phase of the next Bitcoin market cycle.
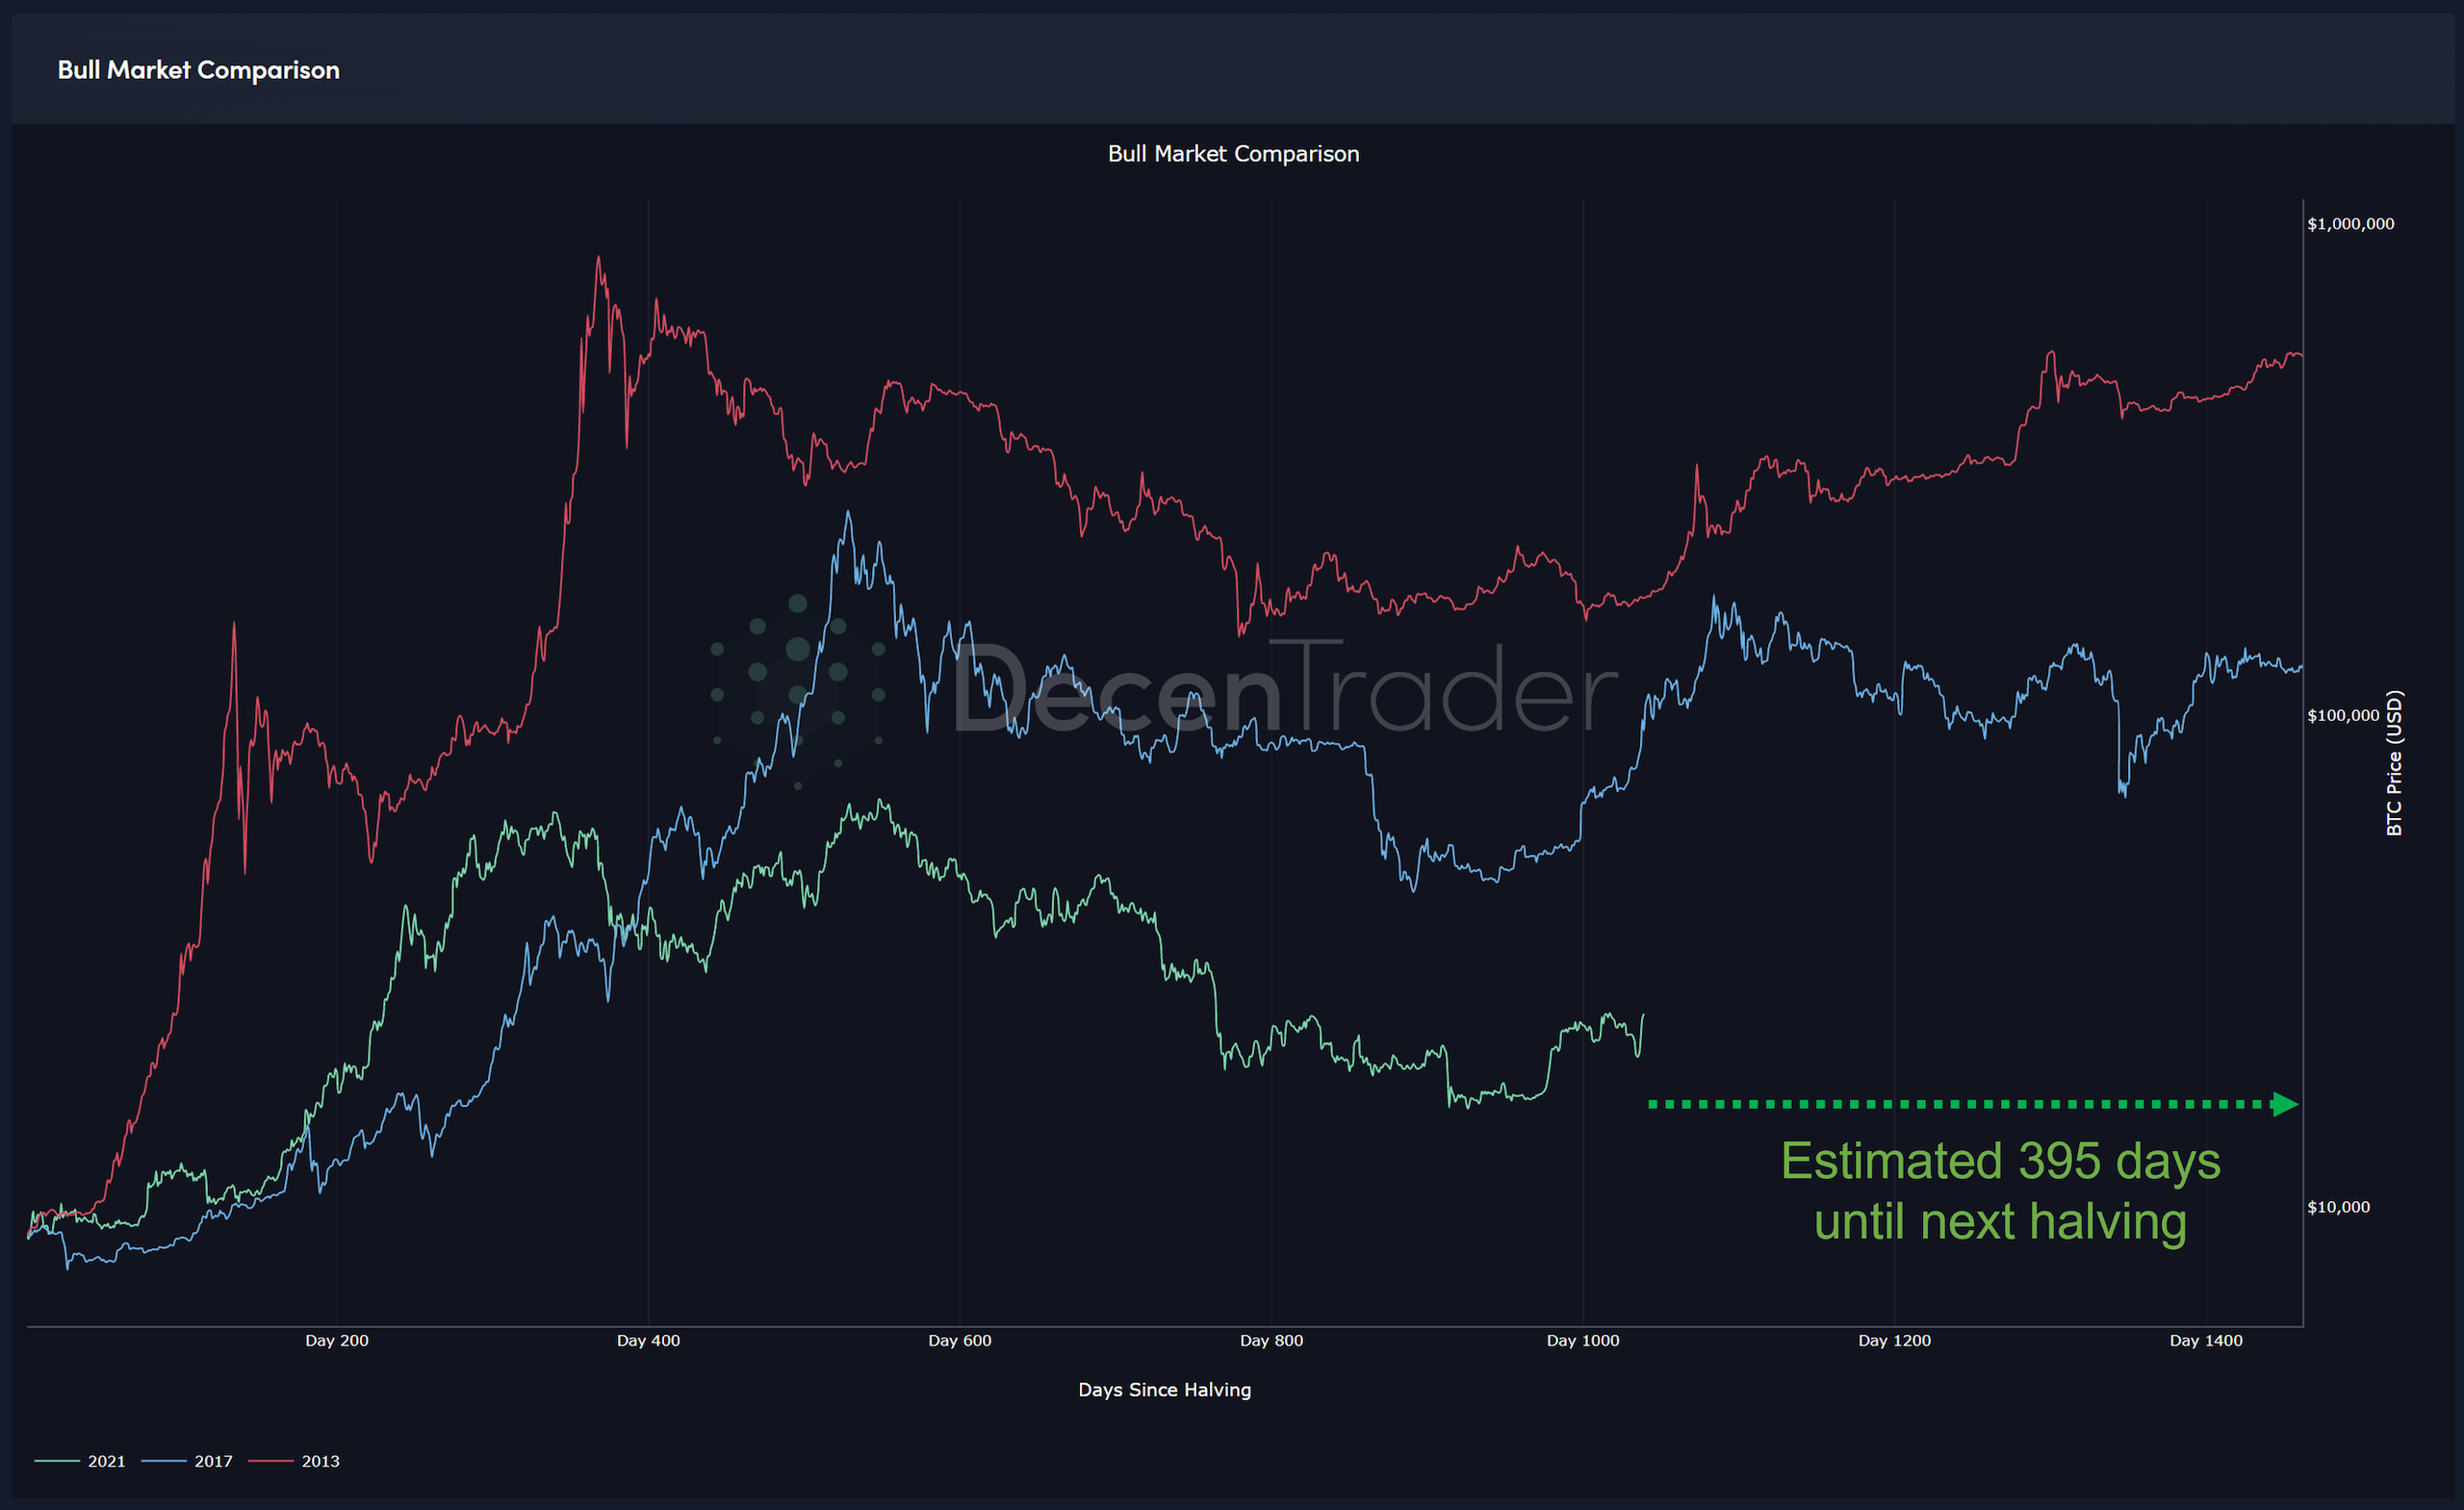 Market cycles from halving dates.
This can also be viewed by looking at Bitcoin prices relationship with its 1yr moving average. The 1yr moving average is an important component of Bitcoin’s market cycles. Price breaking above the 1yr moving average after a bear market downtrend has historically marked the start of a new bull run.
With the exception of the black swan event of the March 2020 covid crash, this has held true throughout Bitcoin’s history.
At the time of writing, price is flirting with the 1yr MA attempting to convincingly break out above it.
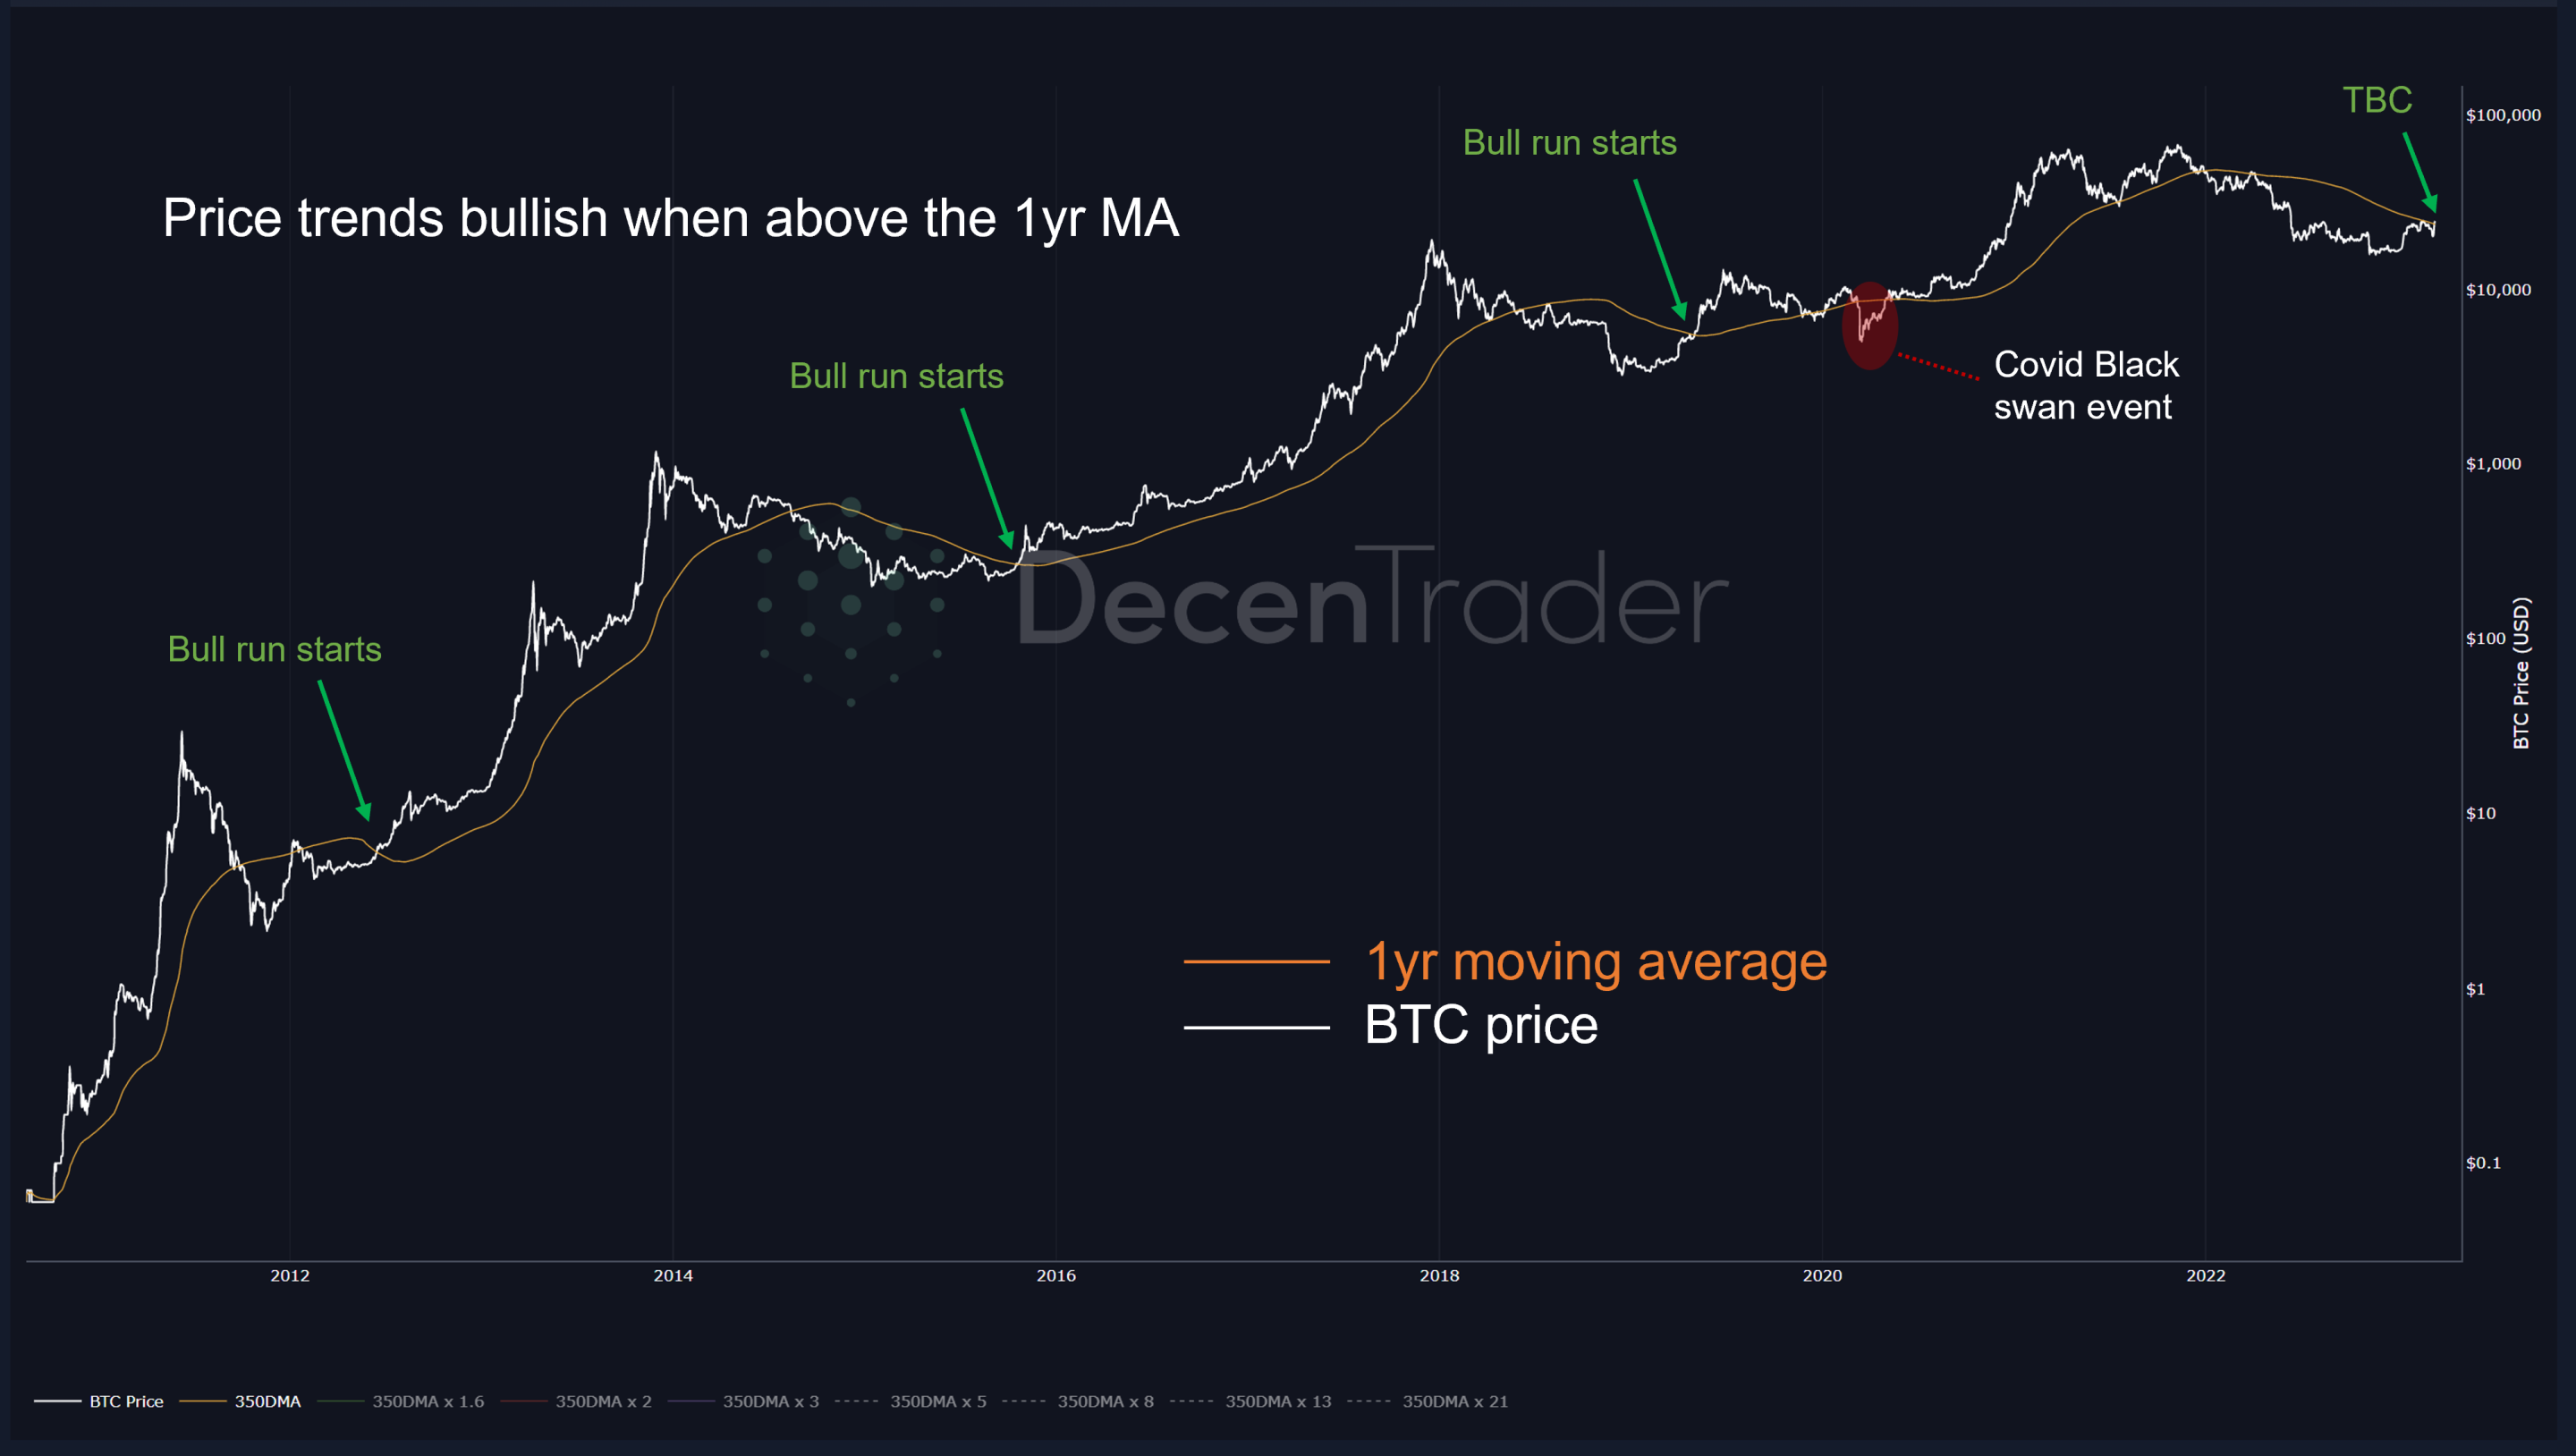 Bitcoin price attempting to convincingly break above the 1yr moving average.
This comes at a time where traditional markets are struggling. Throughout the second half of last year the dominant narrative was that Bitcoin was heavily correlated to traditional markets but was struggling even more to the downside than they were. That narrative has been destroyed since the start of the year with Bitcoin putting in a strong reversion back to the upside, while traditional markets continue to struggle.
High price-to-earning ratios, significant layoffs from major (tech) companies, reduce sales and growth are just a few reasons why traditional stocks have struggled since the start of the year. The S&P +1.94%, DJI is down -3.84% while Bitcoin is up +46.9%.
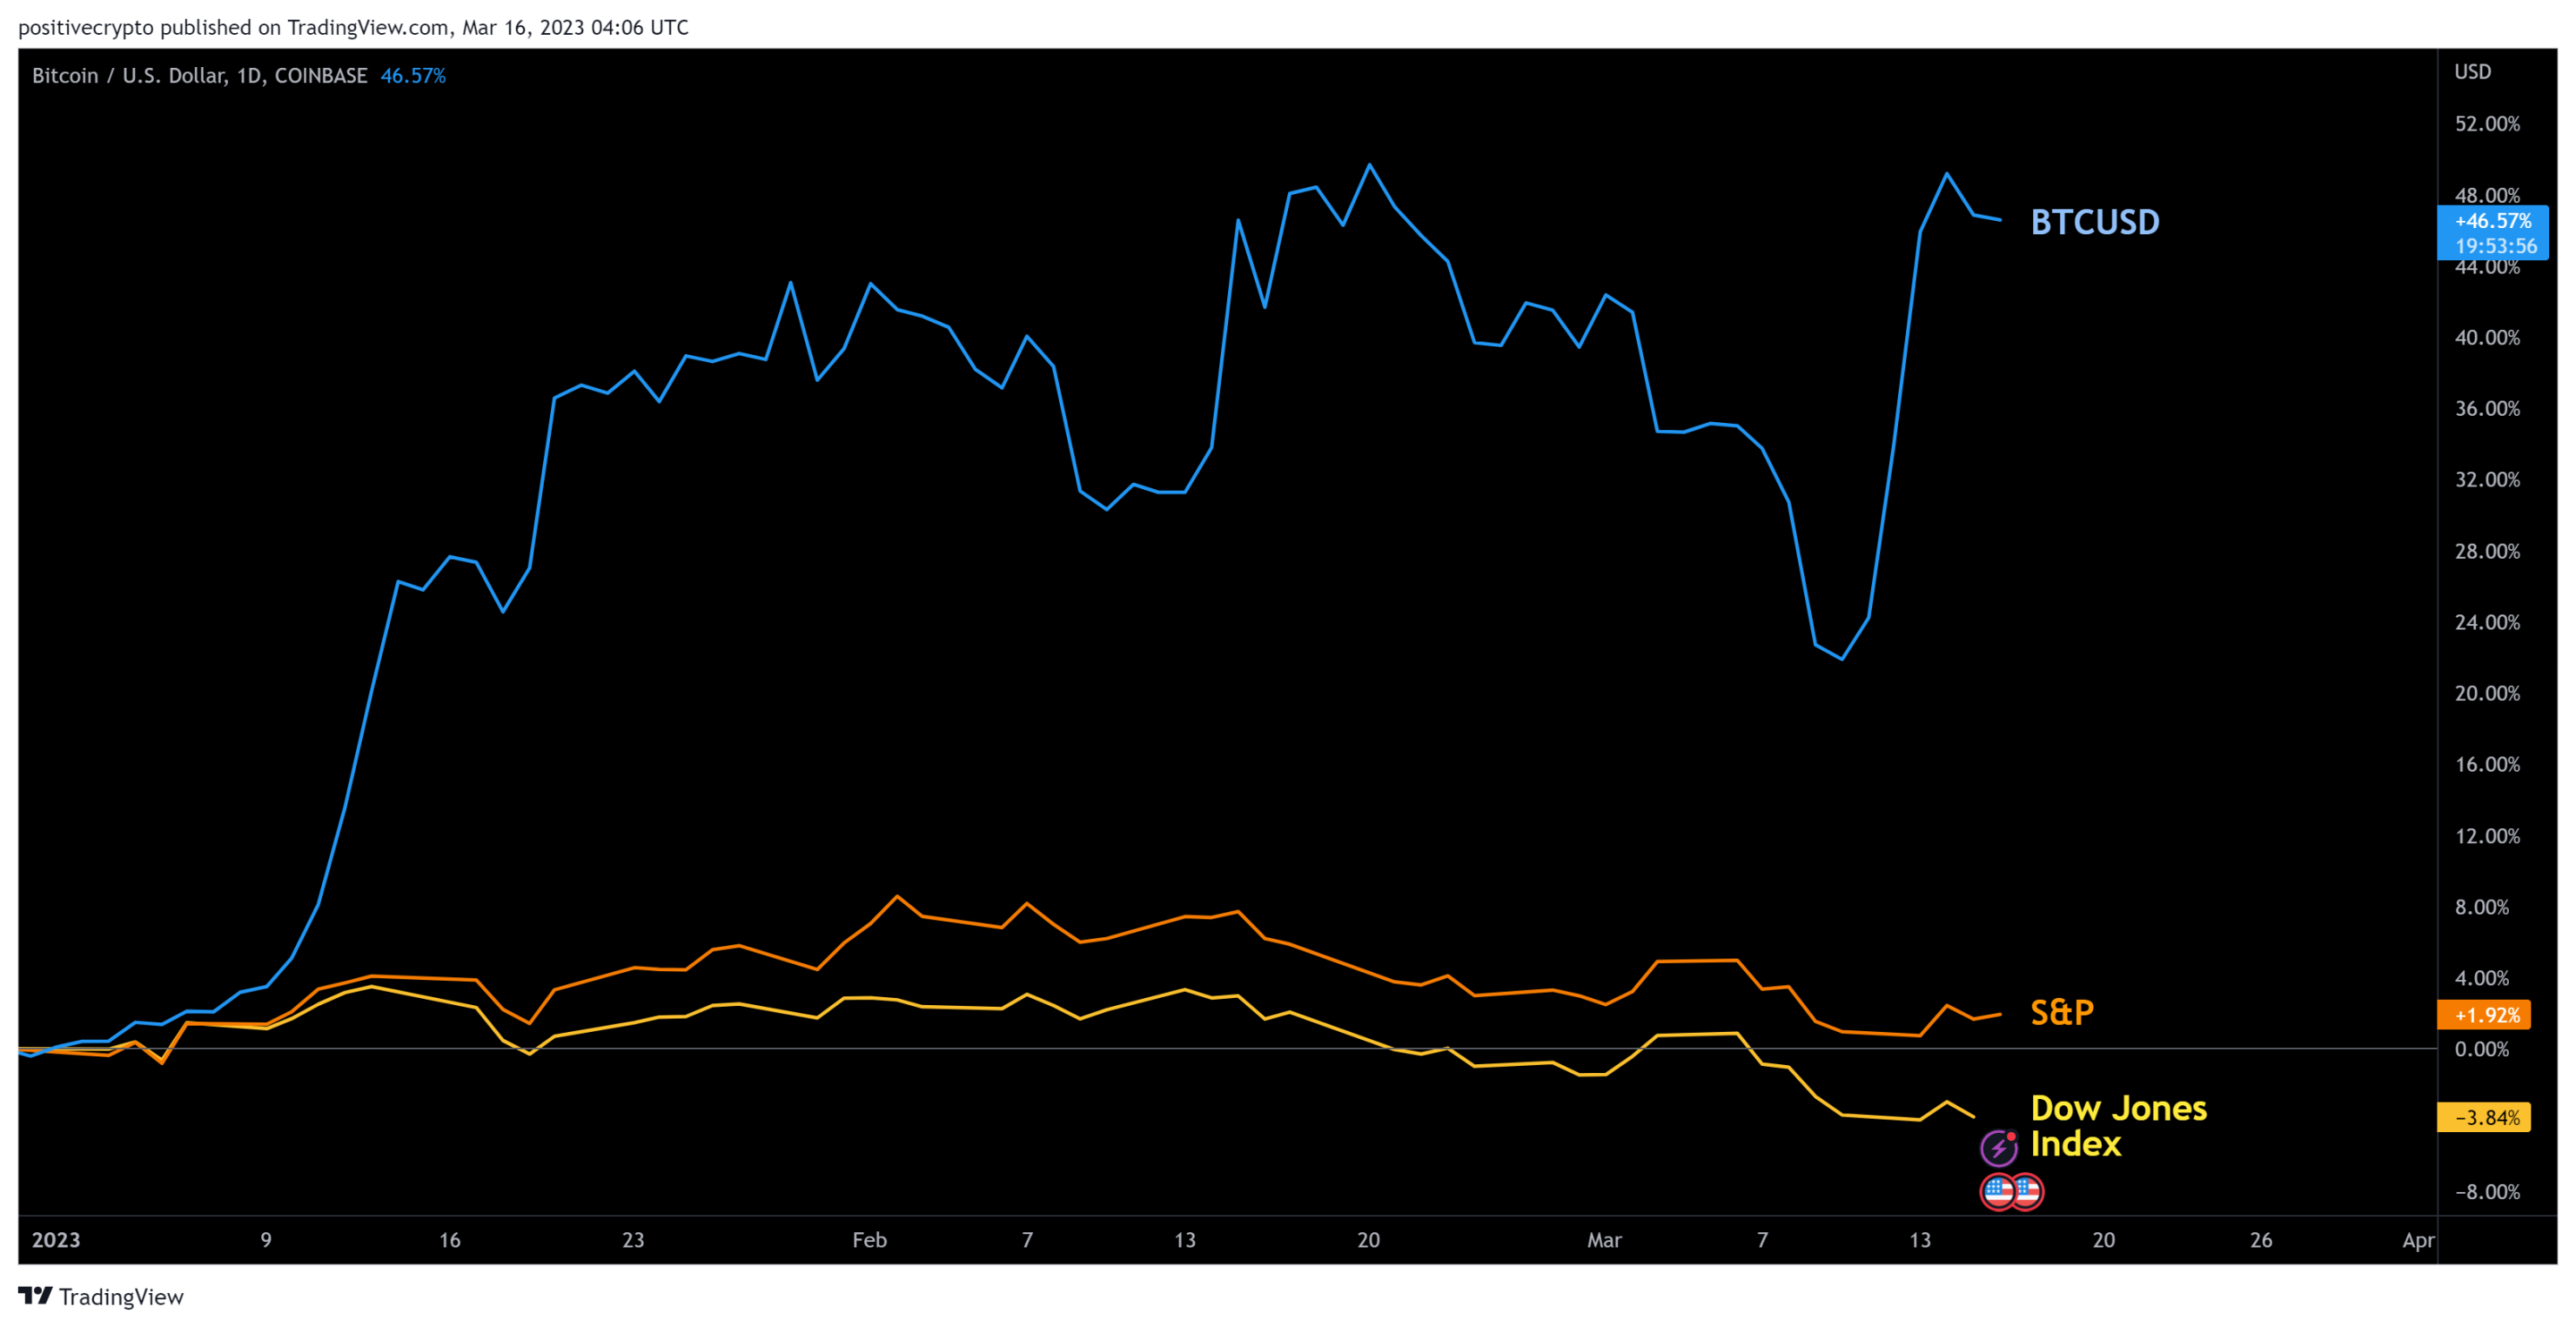 BTCUSD performance relative to S&P, DJI.
That trend has continued this past week as the ripple effect of Sillicon Valley Bank, Credit Suisse, and others in the traditional banking sector demonstrate the risks involved with fractional reserve banking, and why a decentralised, fully auditable asset like Bitcoin is so important.
Bitcoin is up +21% on a relative basis this past week.
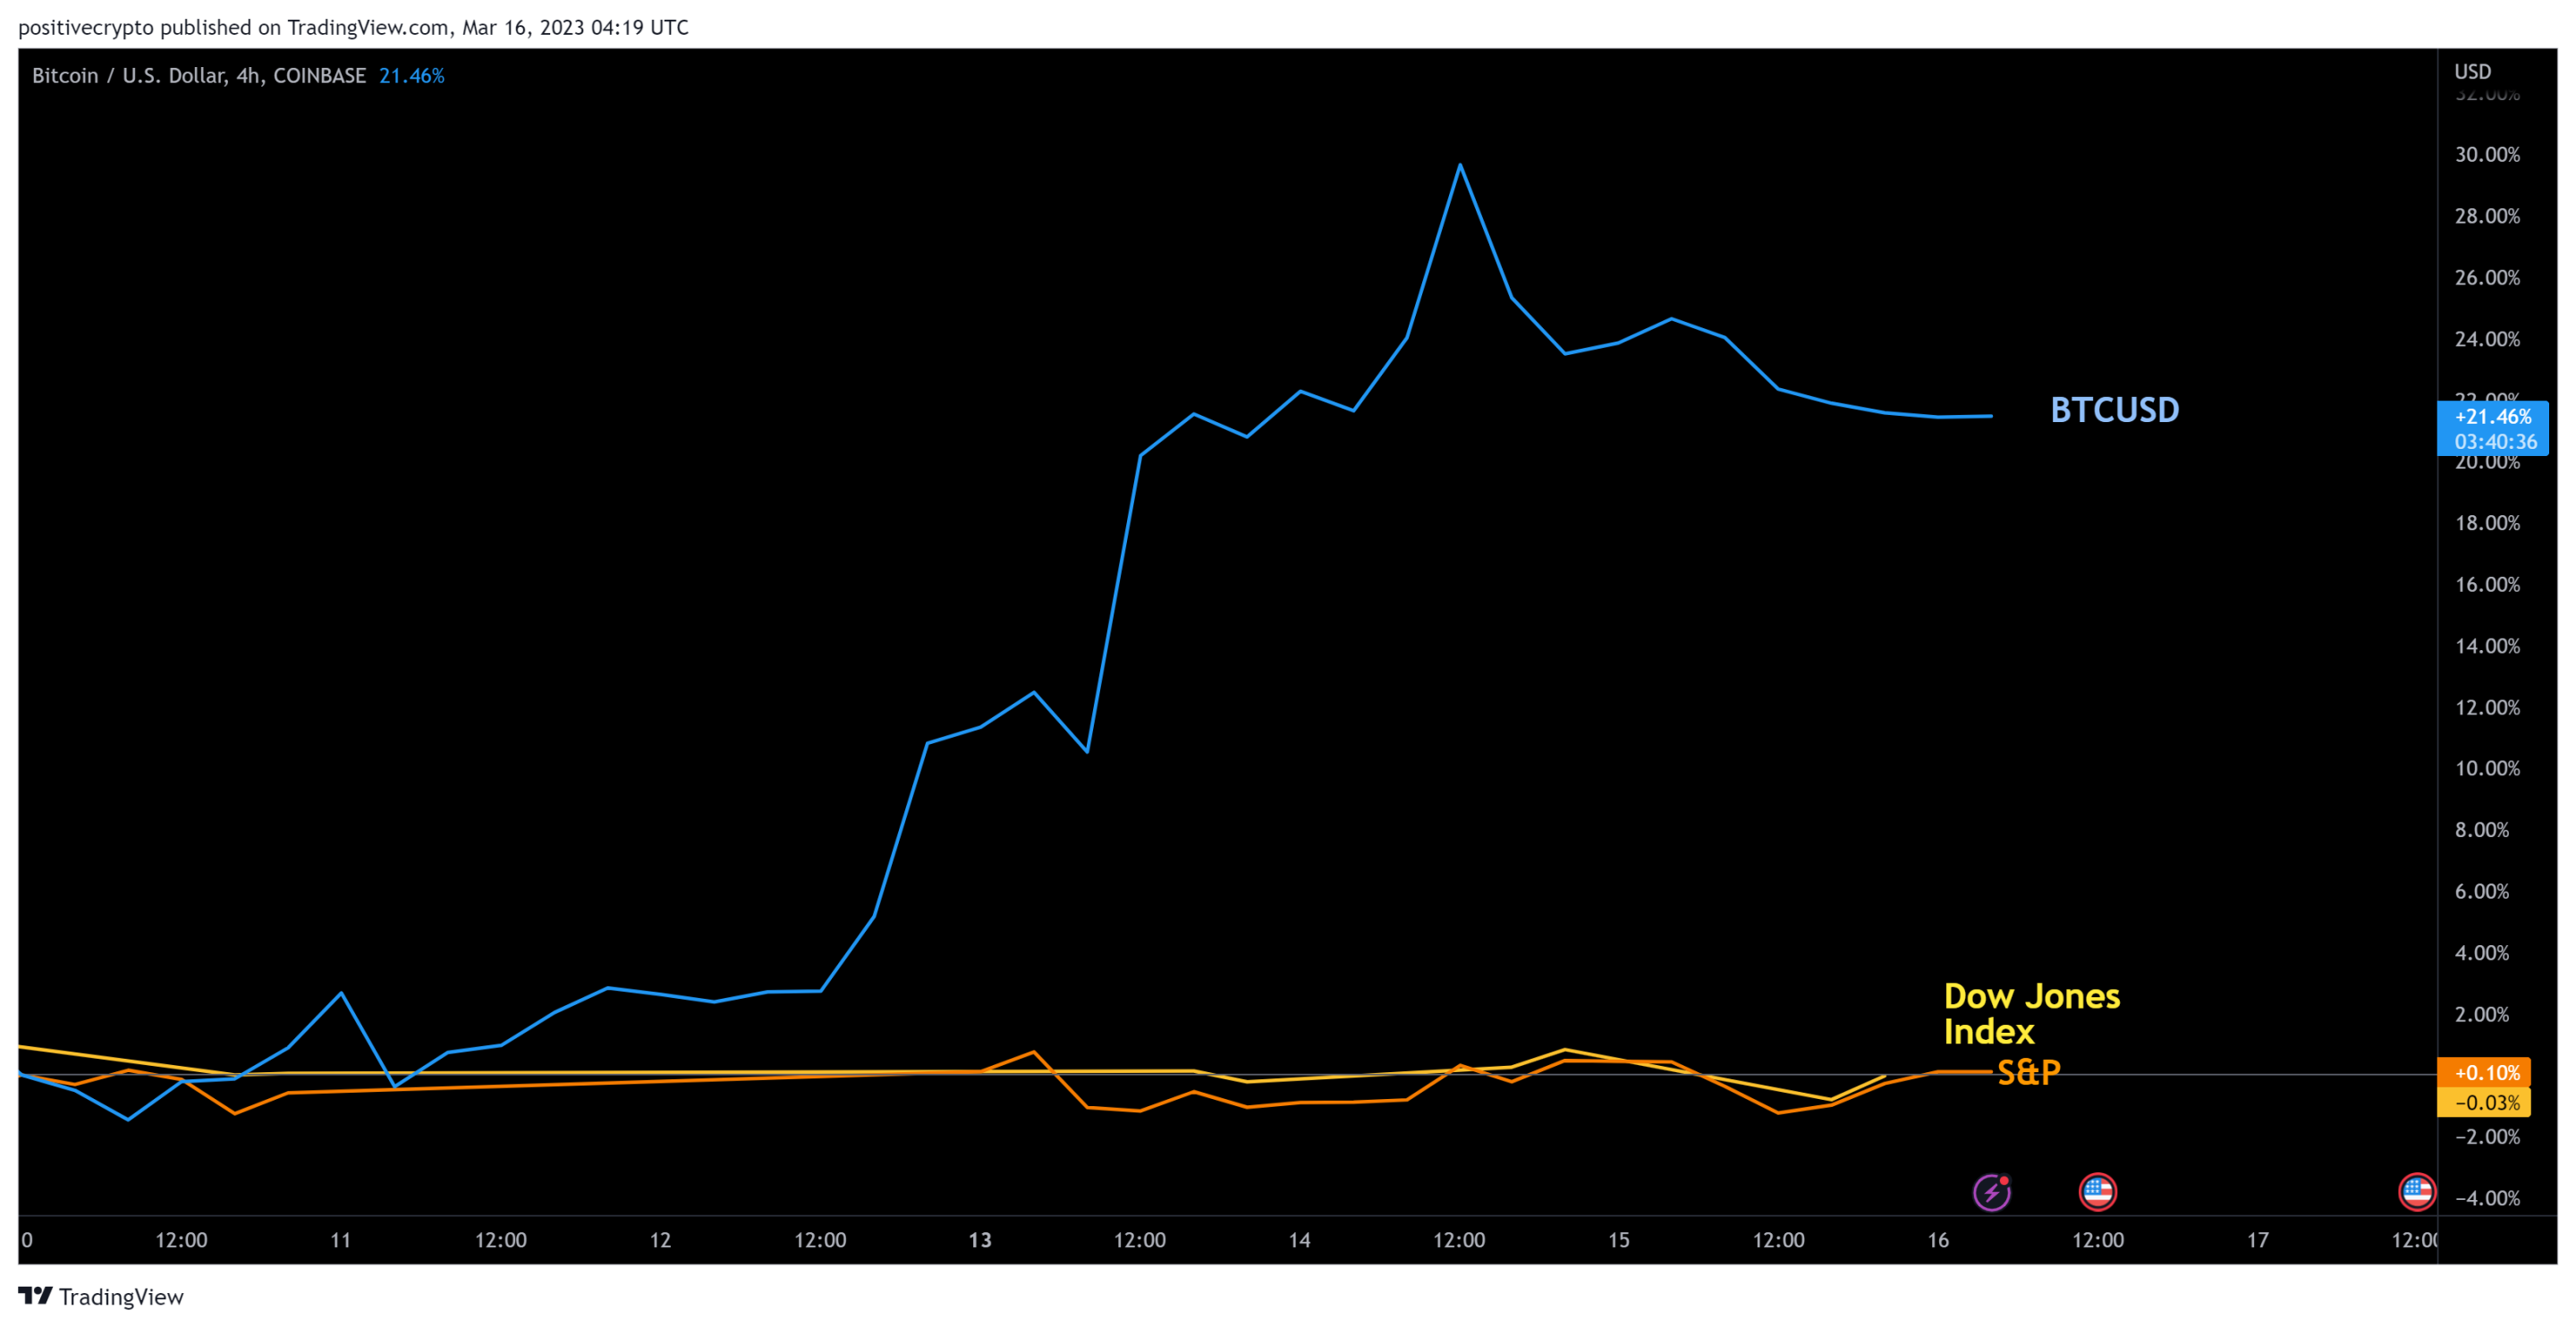 Bitcoin relative performance this past week.
After a violent bounce off the 200DMA, price is now back up at the 200WMA meme-level struggling to break above it at time of writing. If price can break through then there is weekly resistance around $30,000.
The first major support to the downside is daily support at $21,600 – $21,800 on the 1D timeframe.
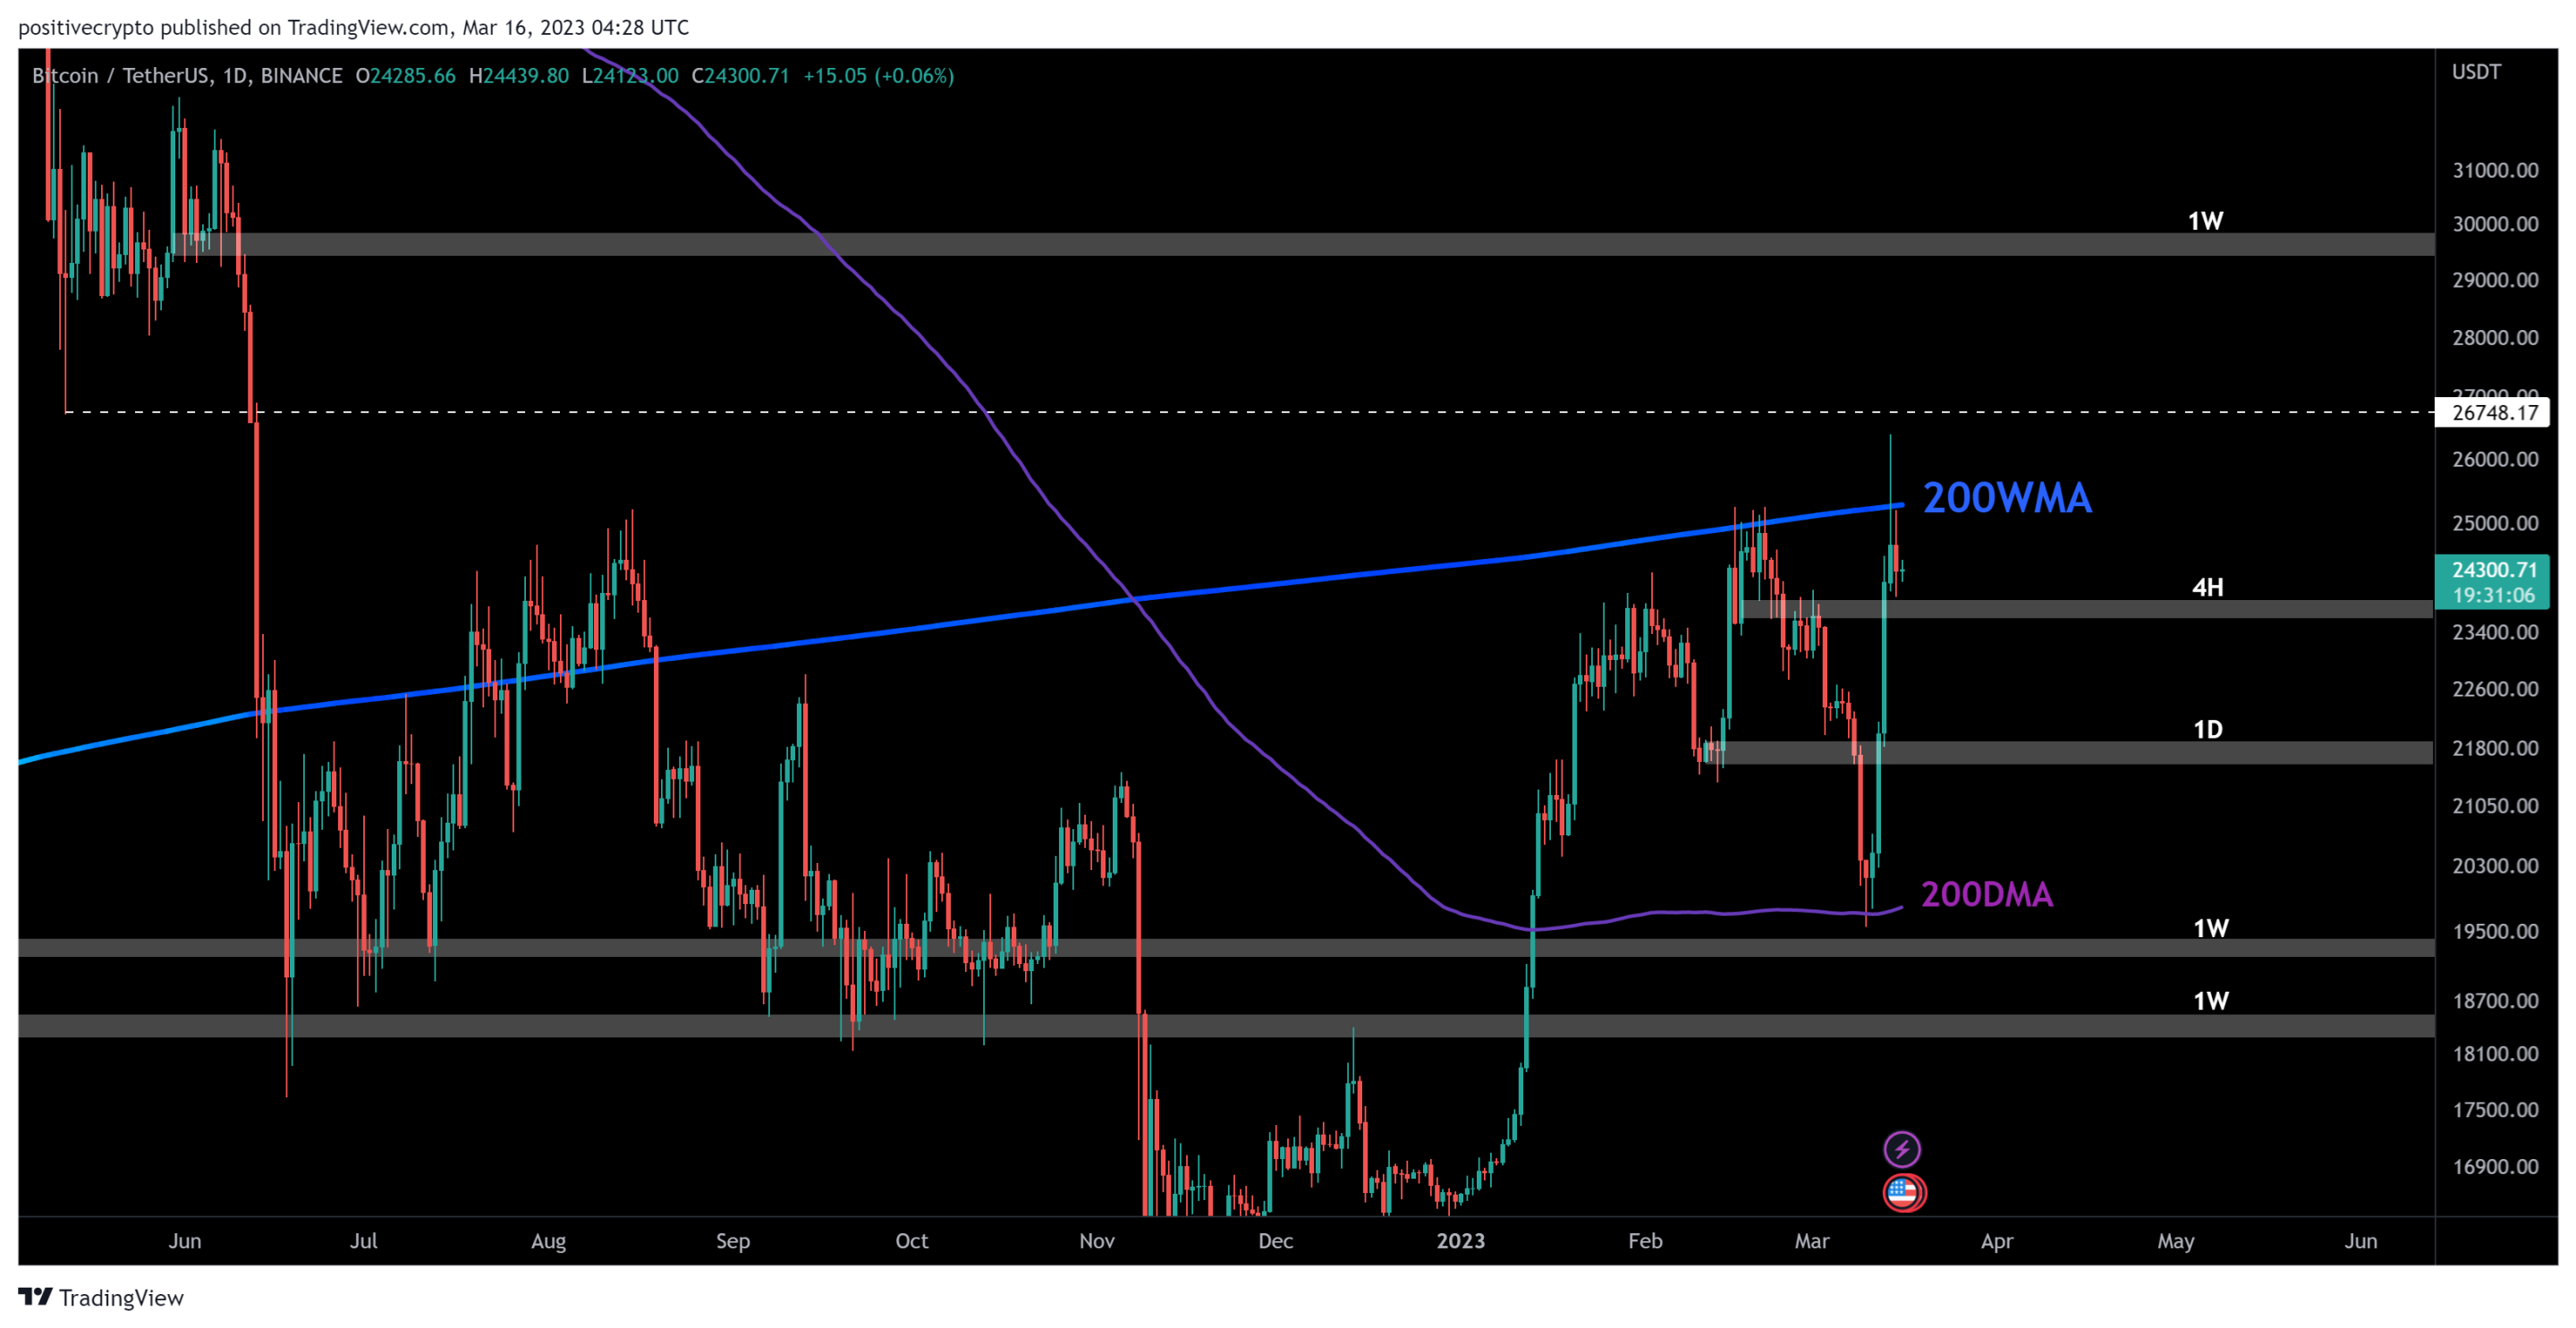
BTCUSDT chart showing 200DMA and 200WMA
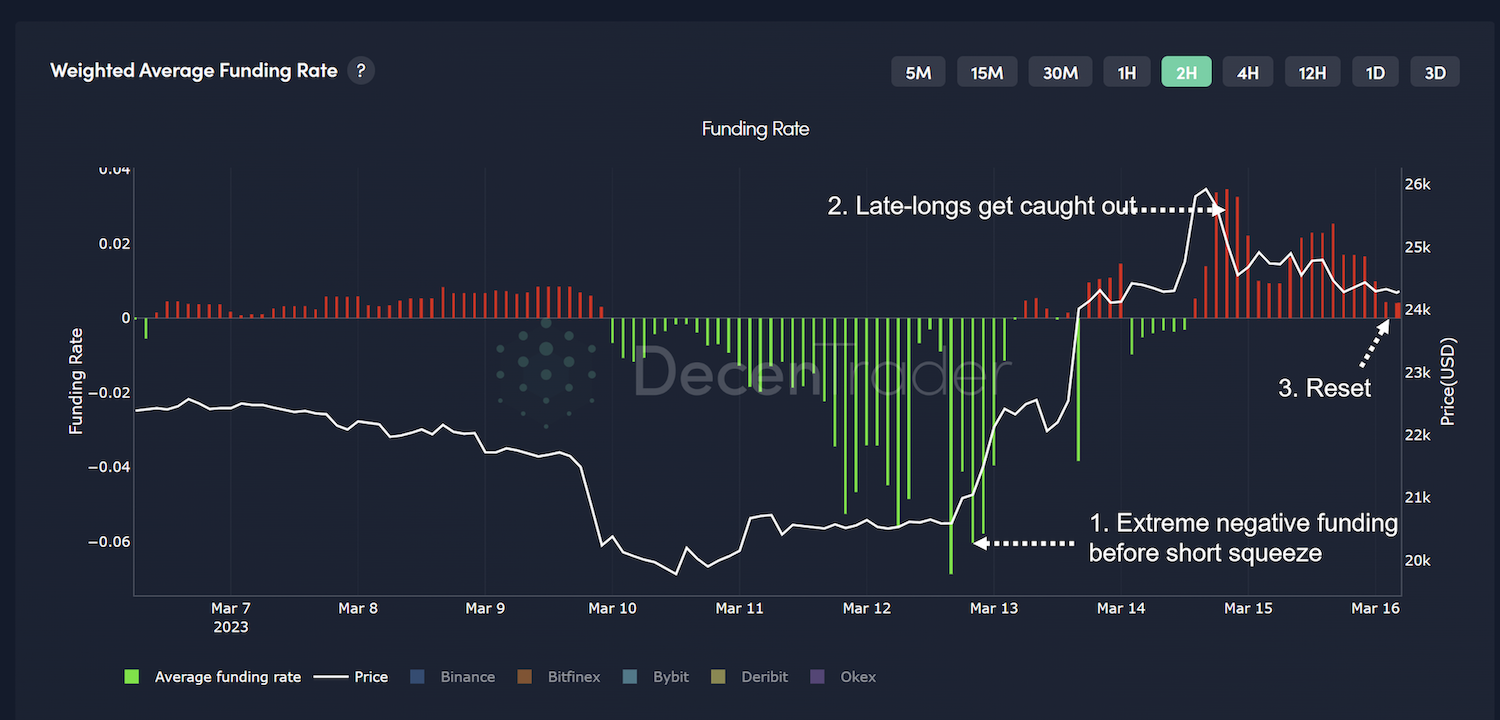
Funding rates have now reset to a more neutral standing after reaching extremes over the past week.
Funding rates went increasingly negative before the major move to the upside as traders expected price to drop further…and ended up getting caught offside as price aggressively rallied against them.
After price breached the 200WMA on Tuesday, late-longers came in, as shown by a spike up in funding rates to 0.03. They were then punished as price moved against them also.
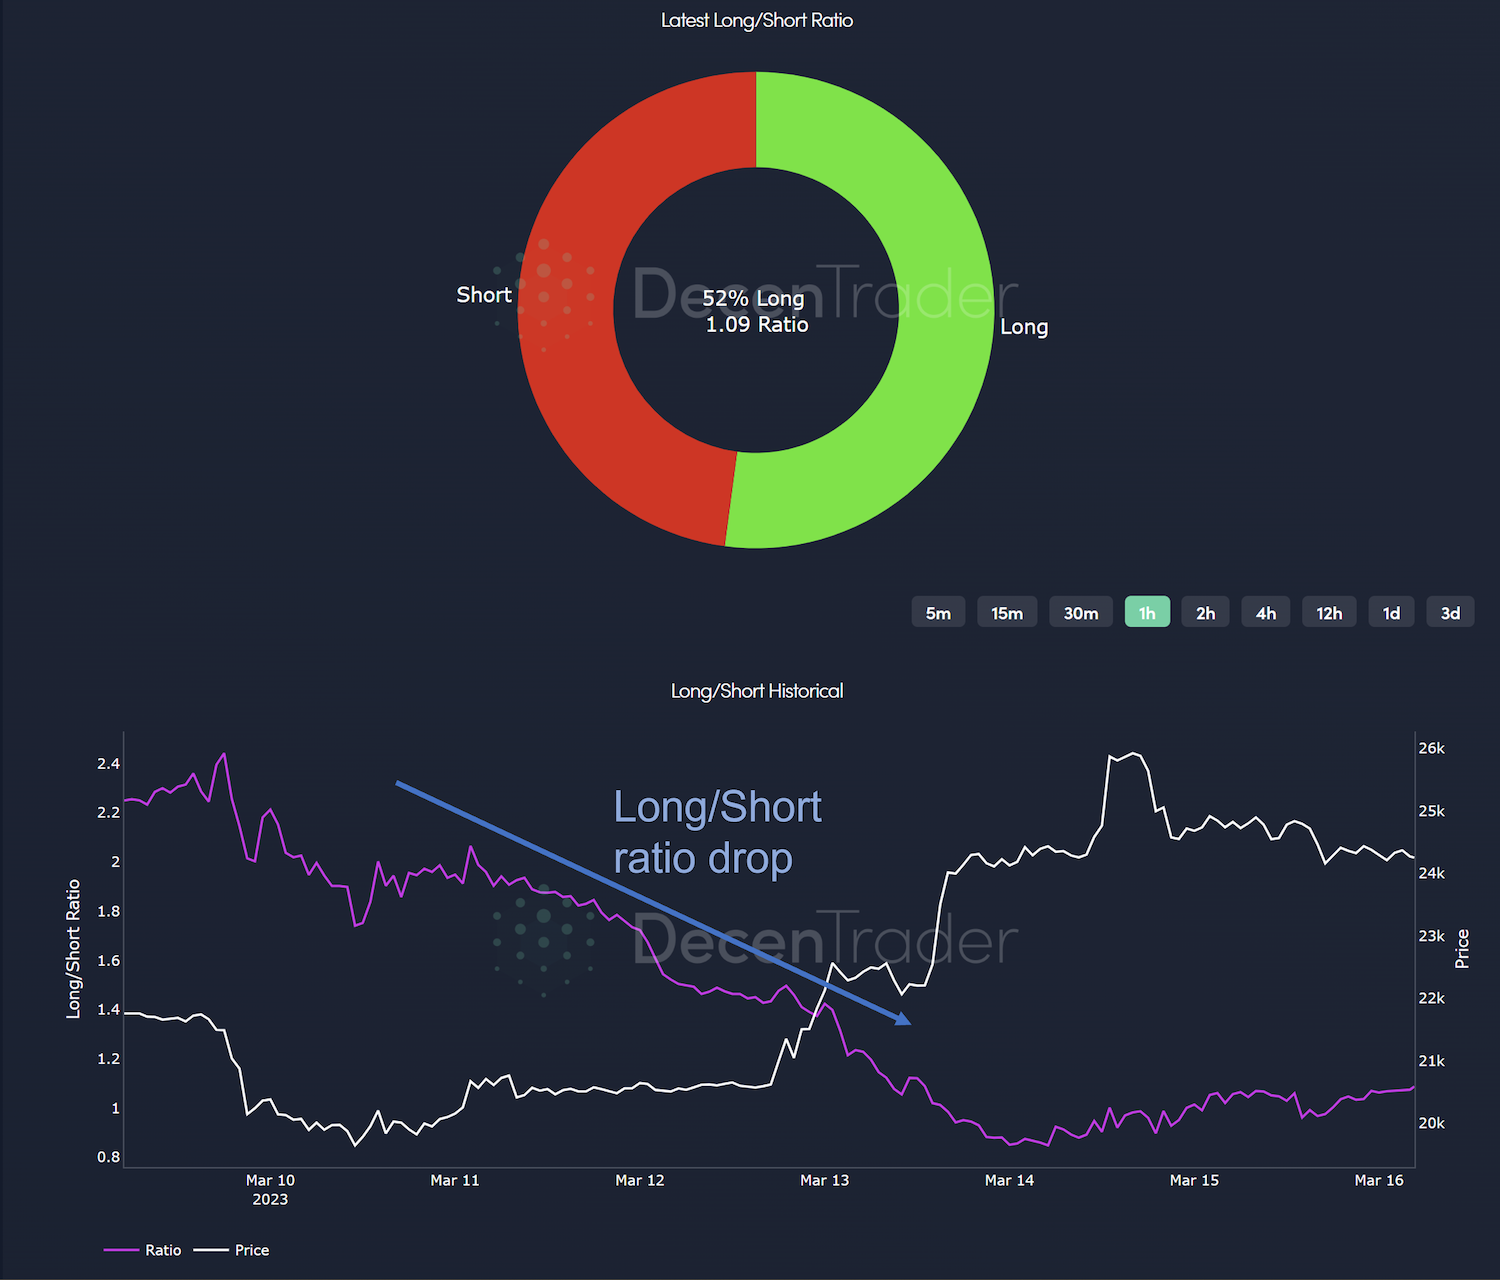
The Long Short ratio has also proved to be extremely useful again during this recent move. The ratio (purple line) began to drop at the lows as more shorts piled in ahead of the eventual squeeze.
Right now there remains a fairly even split of 52% longs vs. 48% shorts as the bears lick their wounds following the aggressive increase in BTCUSD price.
Conclusion
In the near-term the shorts have been squeezed, late-longs punished, and right now price is resting underneath the 200WMA. If price does need to drop down to generate enough momentum to take the next leg up to $30,000, the 1D support at $21,800 is a clear target. But for now 4H support is holding well at $23,900.
Importantly though, we have seen a major narrative shift for Bitcoin with a clear breakaway from traditional markets which continue to struggle due to their economic troubles and bank blow-ups. We may well see outside interest return to Bitcoin if its price rises further and its use case becomes clearer as the traditional banking system continues to implode.
Disclaimer: Nothing within this article should be misconstrued as financial advice. The financial techniques described herein are for educational purposes only. Any financial positions you take on the market are at your own risk and own reward. If you need financial advice or further advice in general, it is recommended that you identify a relevantly qualified individual in your Jurisdiction who can advise you accordingly.


