Where Next For Bitcoin And Crypto?
Hello,
Hopefully, you managed to get through the capitulation of last week’s market crash and are still here to tell the tale.Crypto does have these sorts of events reasonably often, and they do highlight the importance of risk management.
Given the market conditions, we thought people may appreciate an opportunity to access our tools at a discount price. For a very limited time we are offering 25% OFF all our indicators.
You can get the deal here.
We will be using each of those DecenTrader tools in the analysis below.
Low time frames
Since last Thursday’s crash, $BTC rallied and then stalled around the $30,000 level. From a technical analysis perspective, this is not surprising given the daily reversal candle forming resistance, which was the daily level right before price broke down and then finally capitulated.
Acting as support is the 4hr reversal candle from the 12th May post-crash rally. Not surprisingly, price is ranging between these two levels for some time as the market recovers and assesses where to go next.
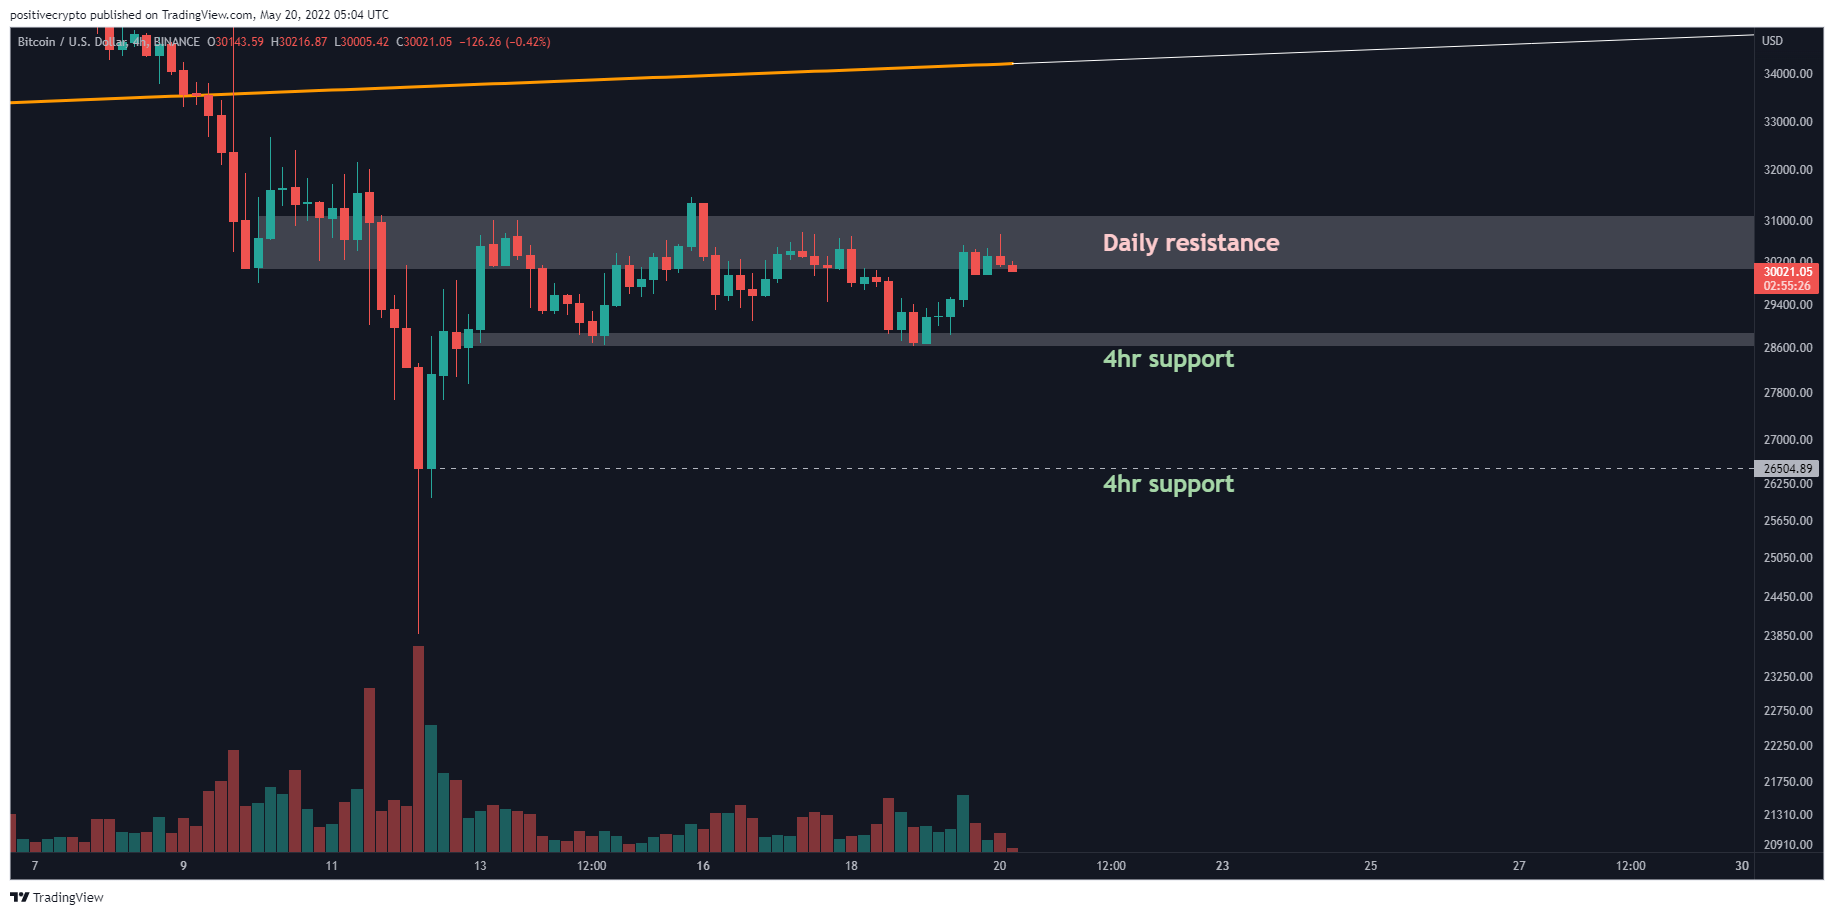
Figure 1: $BTC ranging post-crash between 4hr support and 1D resistance.
Should we lose the current support at $28,670 then the final support before new lows sits at $26,512. To the upside, should price break through the daily resistance then the lower boundary of the Log Growth channel is at $34,270.
Deep into the bear market
Ultimately we continue to sit in a bear market. This has been the case since price retreated away from the 1yr moving average which we highlighted as a key risk in previous DecenTrader market updates when price got rejected off that level.
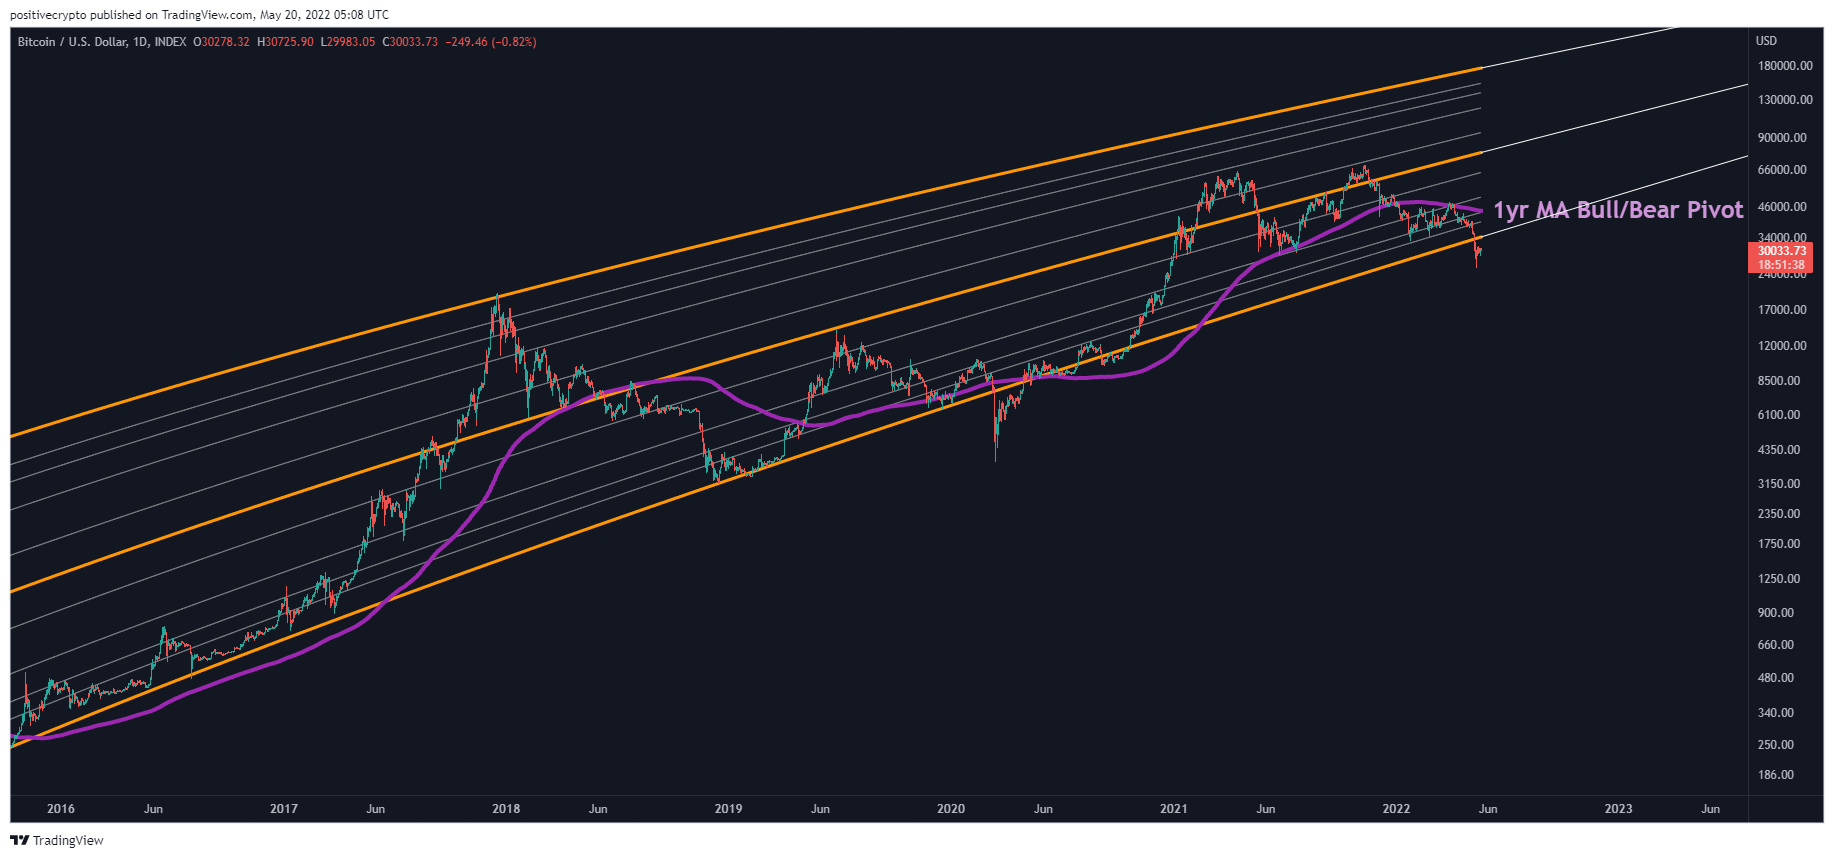
Figure 2: The 1yr MA acts as a pivot level for Bitcoin bull and bear markets.
Until we can reclaim that level we have to face the reality that we are in a bear market for $BTC. That 1yr MA currently lines up neatly with Moonraker resistance around $44,200.
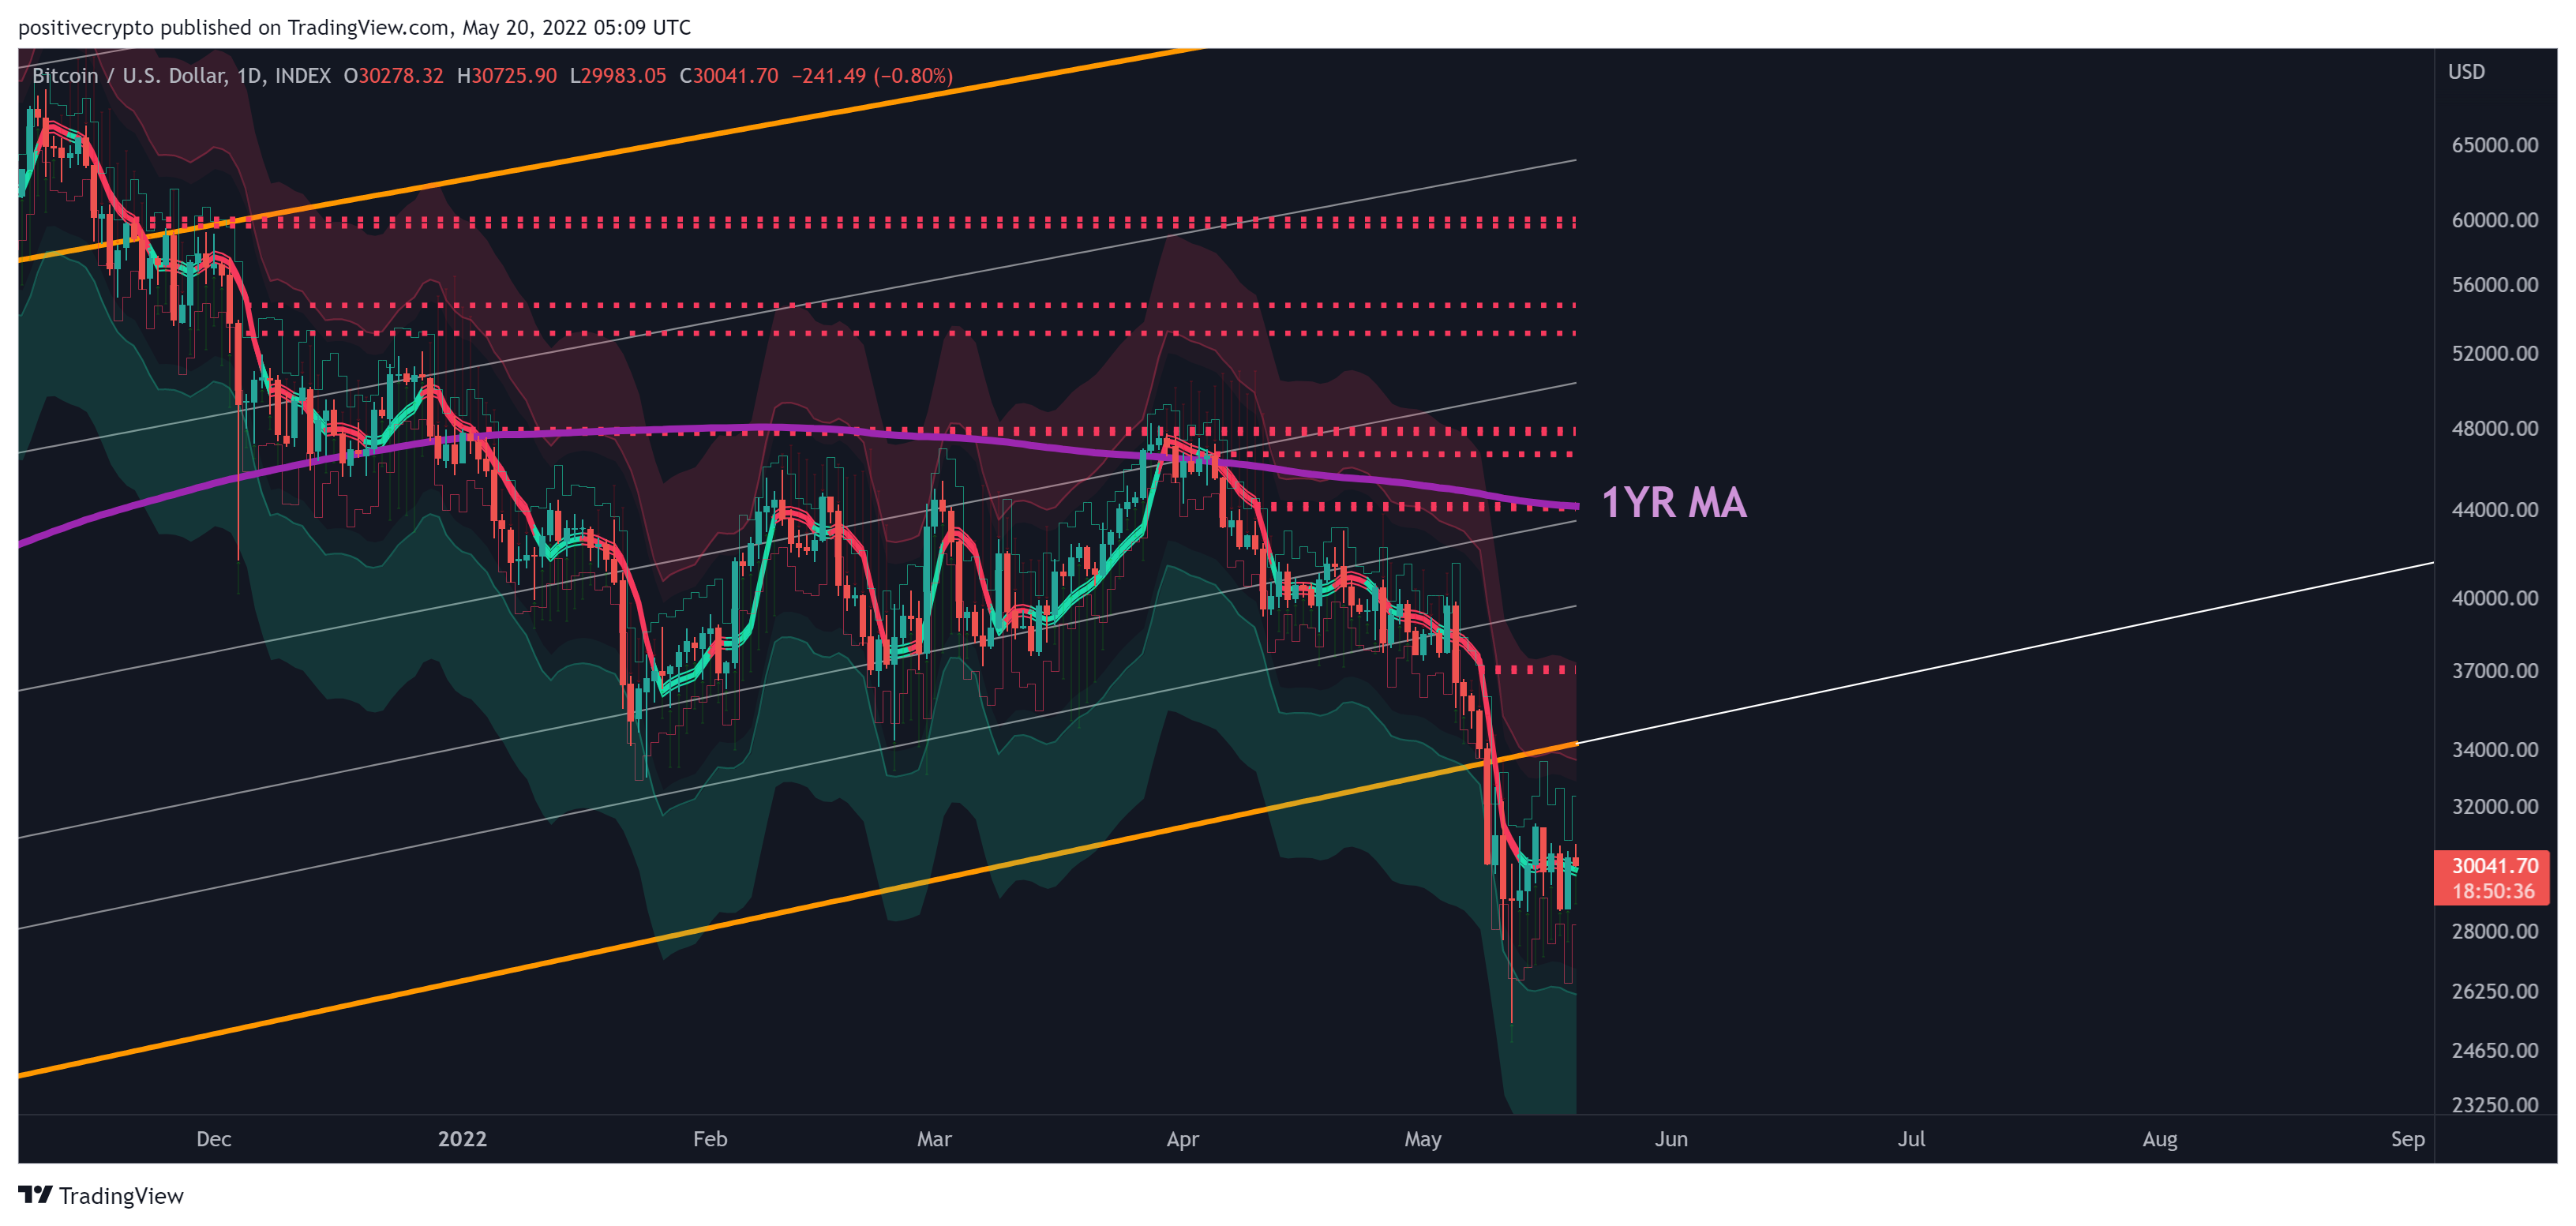
Figure 3: The key moving average lining up with Moonraker resistance.
Should price rally to the upside, that $44,200 level would be a key level to watch out for as major resistance. We remain in bear territory until we can convincingly reclaim it.
200WMA Heatmap
Bears will be continuing to look down and will be eyeing up the 200WMA which is climbing and now at $21,886. It has historically been the last line of resistance. Will we revisit it again in the coming weeks? It is possible if $BTC is unable to decouple from traditional markets and they continue to tumble. Though $BTC has now retraced -65% from the highs so we do question how much further it may retrace.
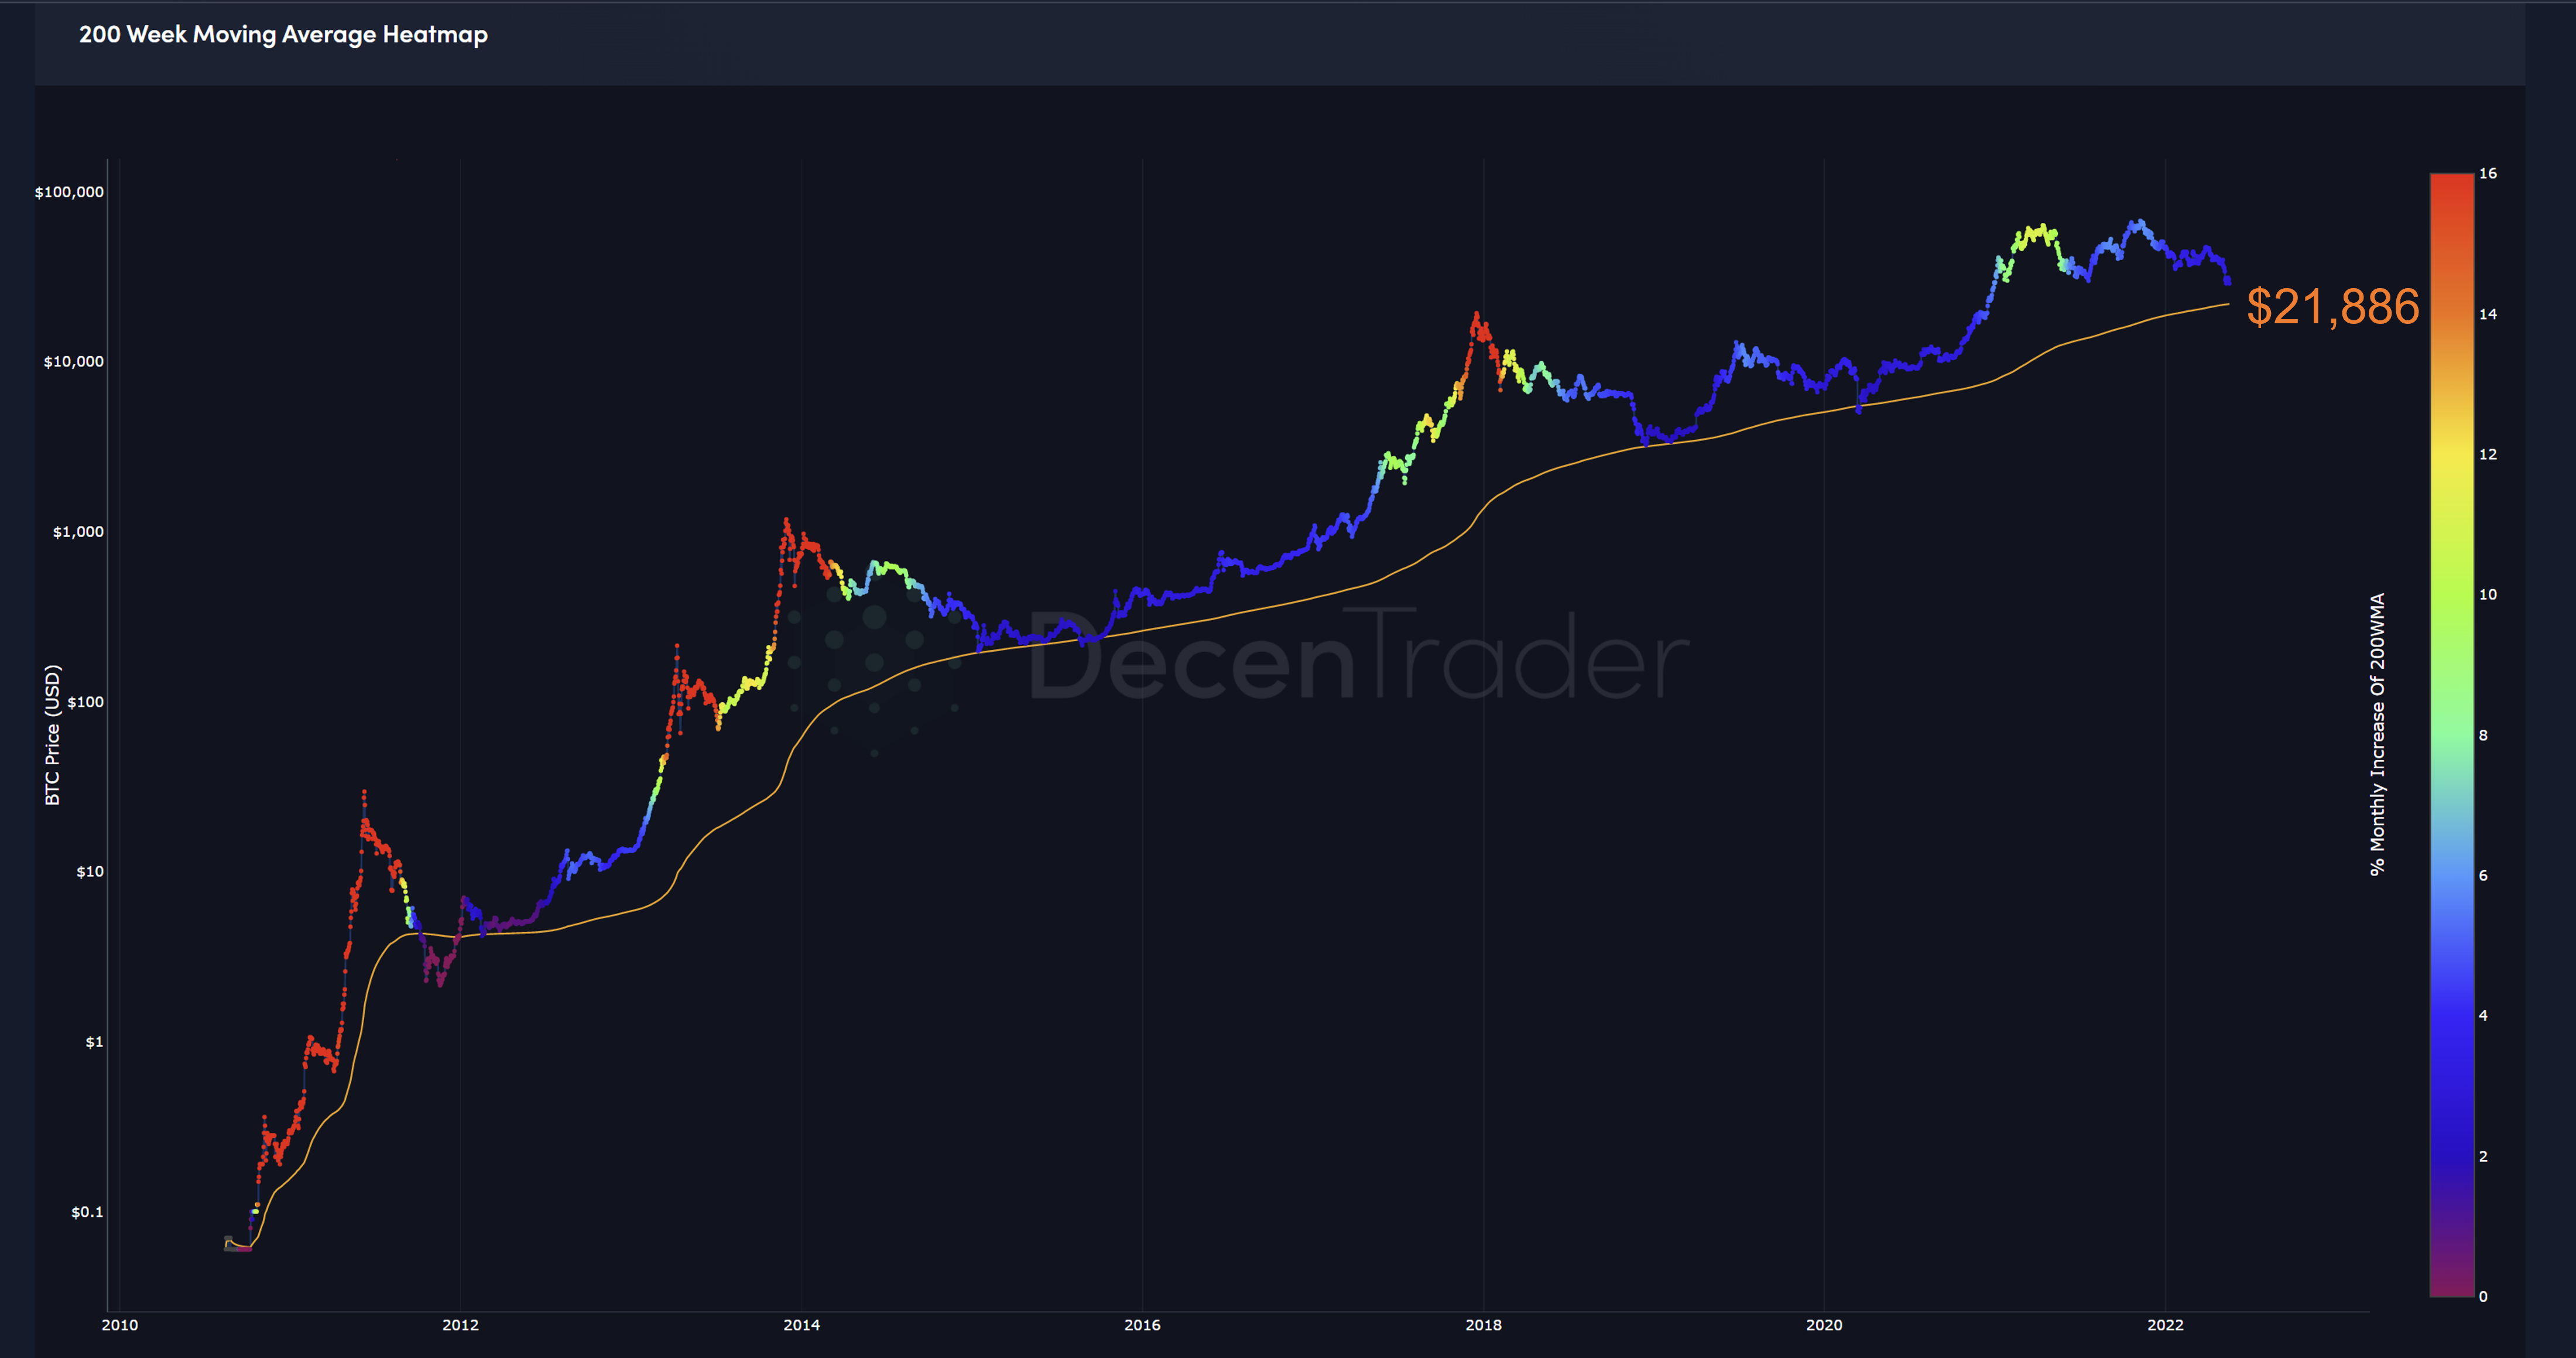
Figure 4: The 200-week moving average heatmap.
FOILS Dashboard
At the time of writing, Bitcoin is being rejected off the daily resistance level highlighted in figure 1.The free DecenTrader FOILS dashboard is also showing bearish levels for funding and open interest on the 4hr timeframe.
Though overall on higher timeframes funding rates, open interest and longs/shorts ratio are at reasonably neutral levels. This is due to last week’s crash wiping out a lot of froth in the derivatives market.
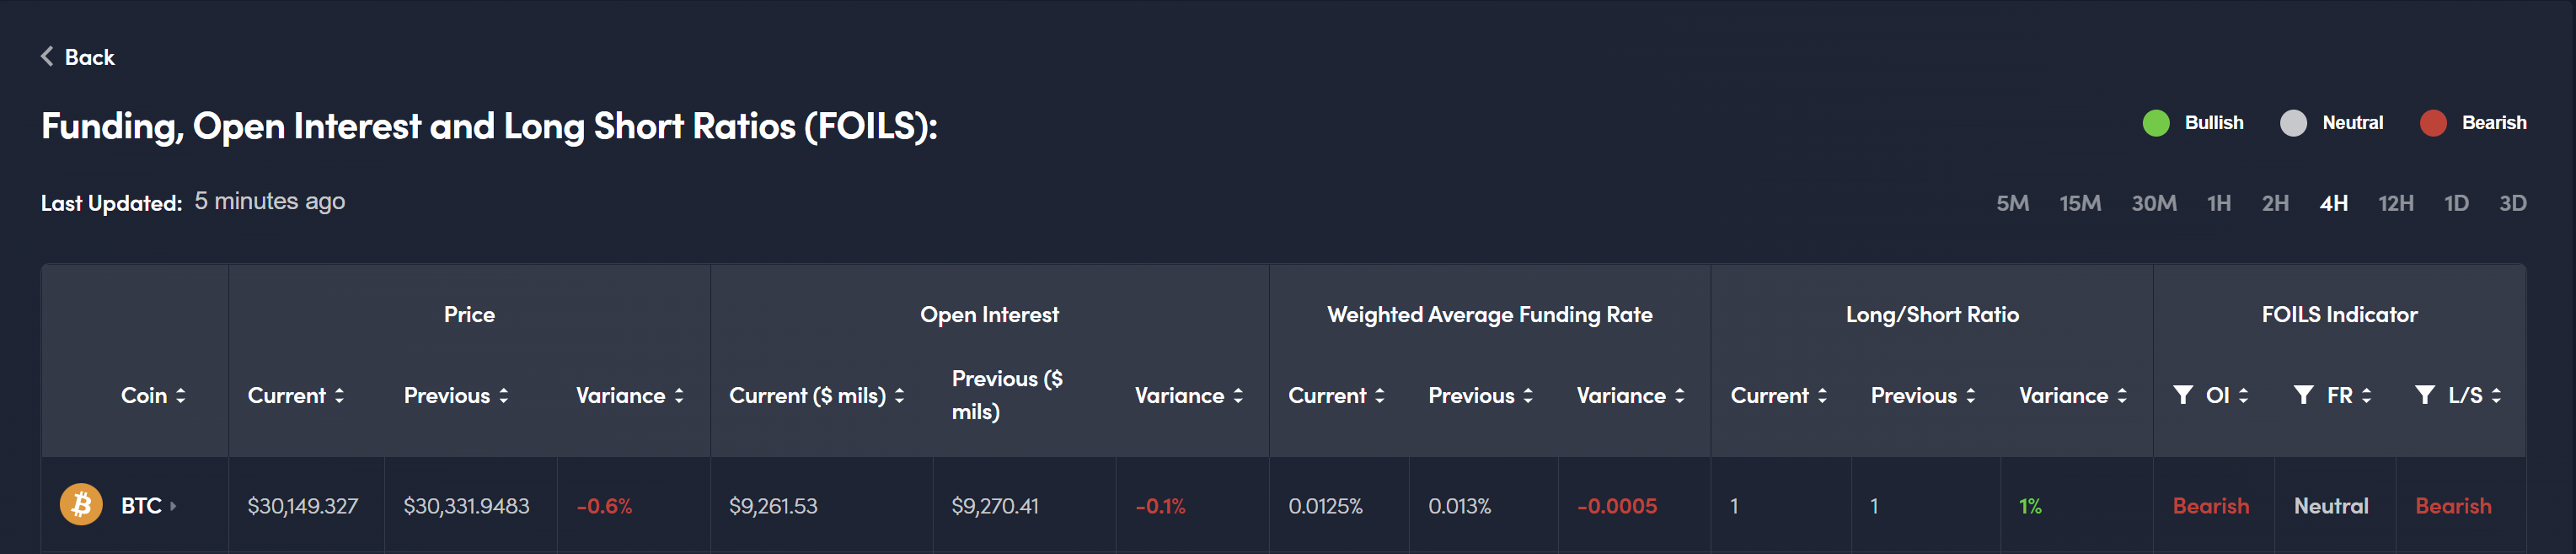
Figure 5: FOILS dashboard on 4hr timeframe for Bitcoin.
Predator Cross Timeframe
Predator cross timeframe is looking more positive than it did before last week’s crash. We are now starting to see some timeframes turn bullish. However, the 1hr is currently bearish which we will need to monitor closely heading into the weekend.
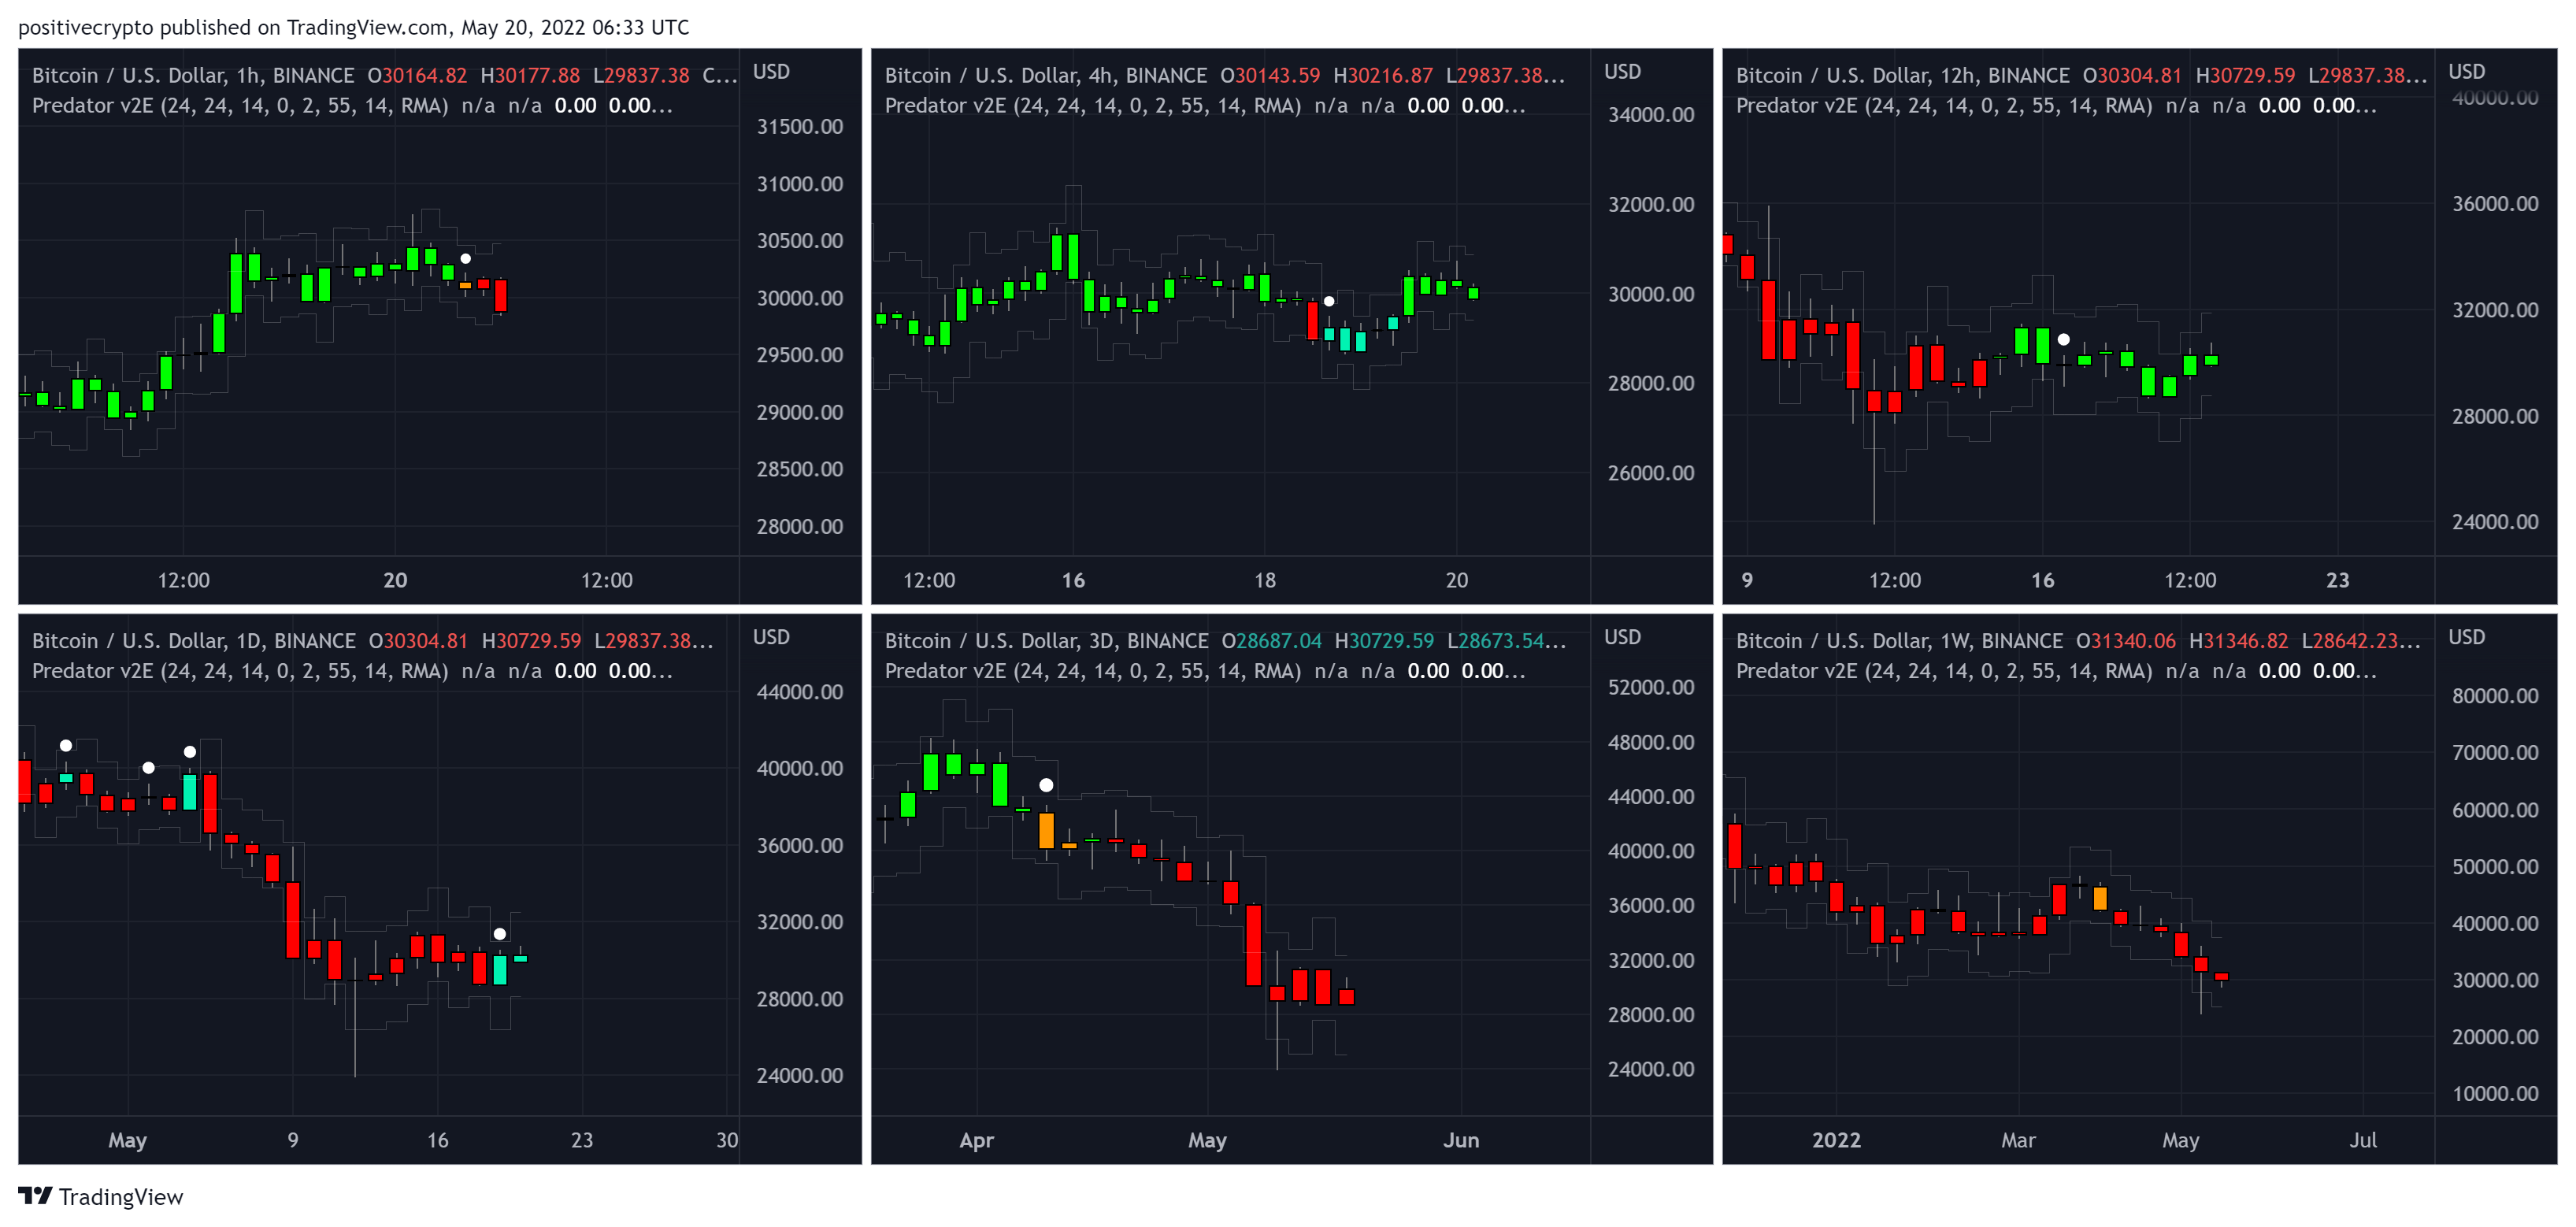
Figure 6: Predator cross timeframe.
Predator summary:
- 1hr: Bearish
- 4hr: Bullish
- 12hr: Bullish
- 1D: Semi-Bull
- 3D: Bearish
- 1W: Bearish
Commando is not fearful
Much of the market is still fearful after last week’s crash. Many traders are waiting on the sidelines. The Commando dashboard uses algorithms rather than emotions and so is able to continue identifying trade opportunities throughout any market conditions.
Right now several coins including HBAR and TEL look like they may be setting up for potential near term moves to the upside:
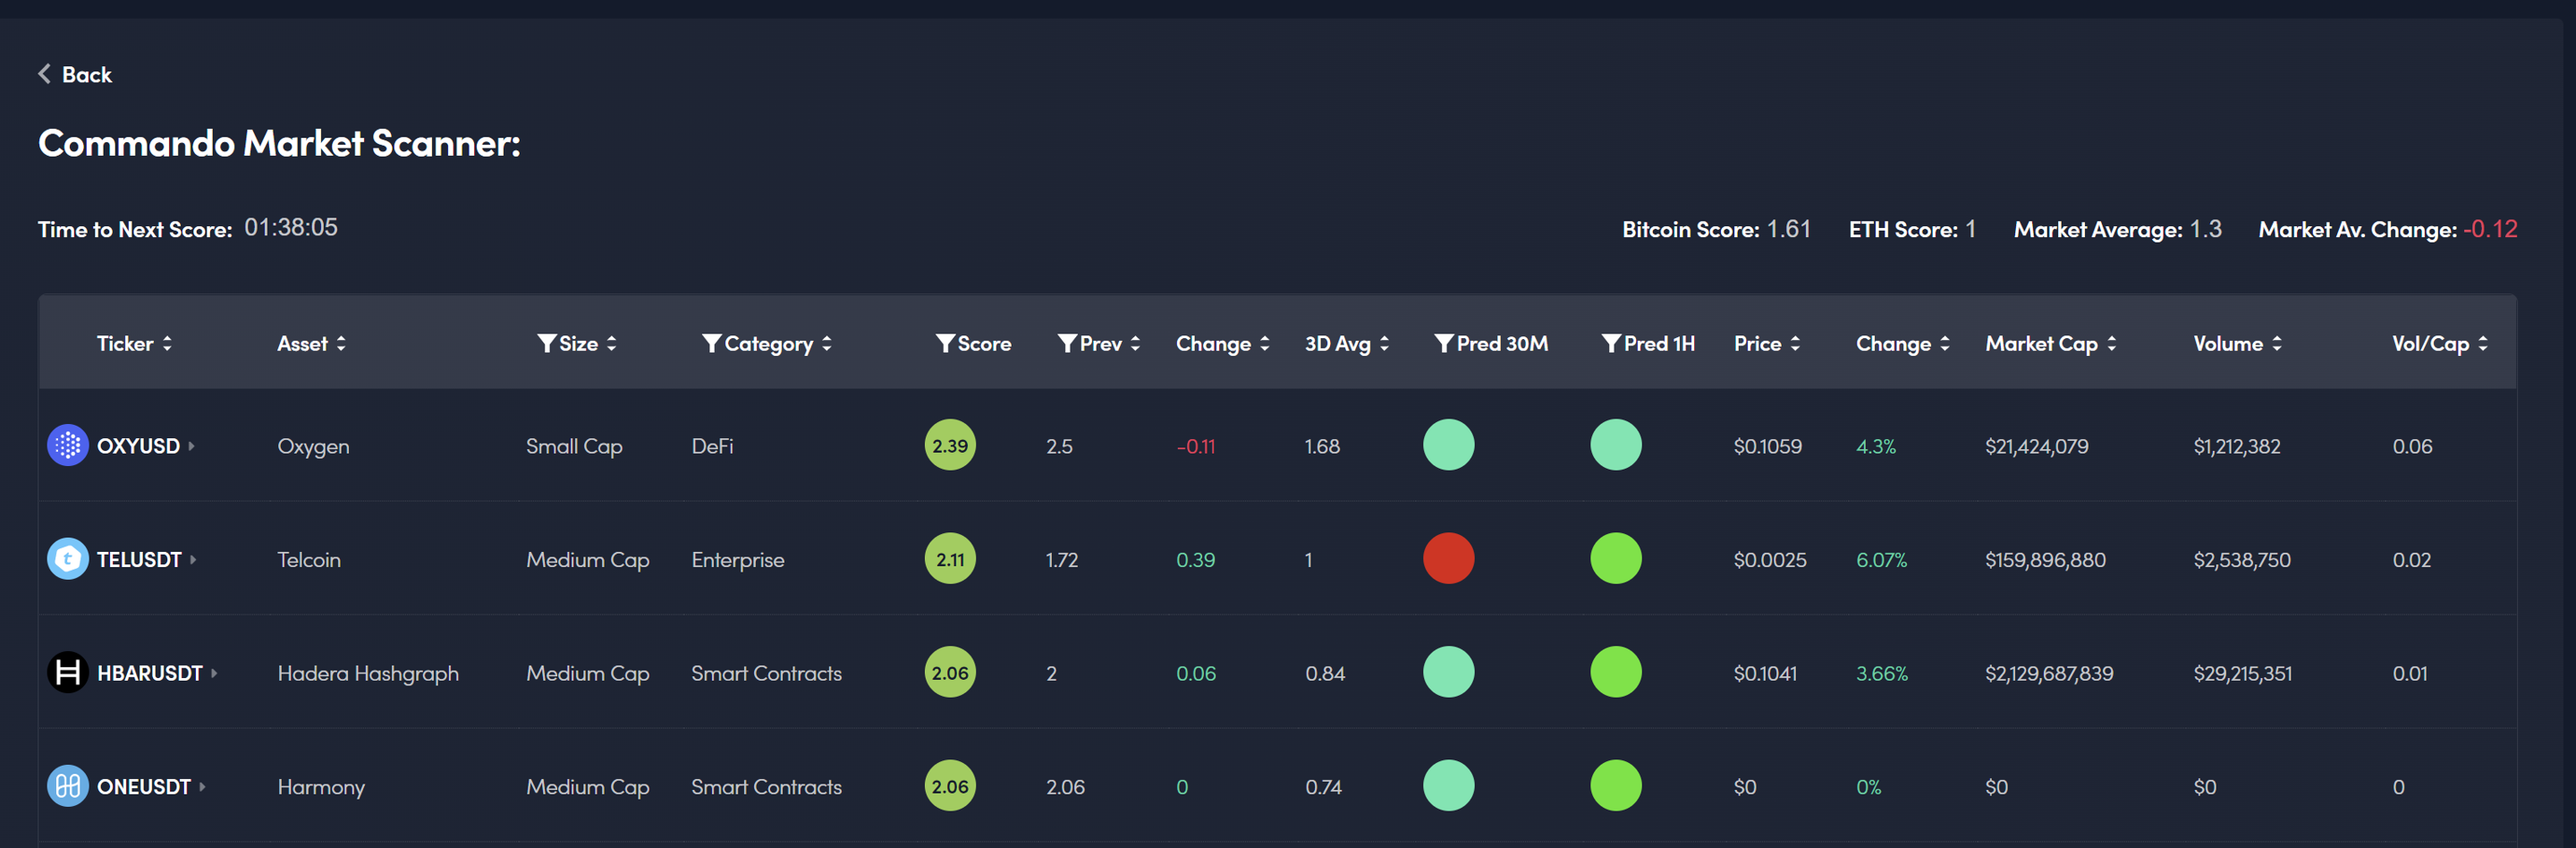
Figure 7: Commando Dashboard highlighting long trade opportunities.
Filb YouTube Overview
Finally, DecenTrader’s Filb provided his in-depth view of the maket right now on YouTube this week. You can check out the full video here:
And remember, you can take advantage of the limited-time 25% off deal for each of our indicators which you can access here.
Disclaimer: Nothing within this article should be misconstrued as financial advice. The financial techniques described herein are for educational purposes only. Any financial positions you take on the market are at your own risk and own reward. If you need financial advice or further advice in general, it is recommended that you identify a relevantly qualified individual in your Jurisdiction who can advise you accordingly.


