The DecenTrader Toolkit
A suite of seven premium trading tools designed for a wide range of trading conditions.
PMO
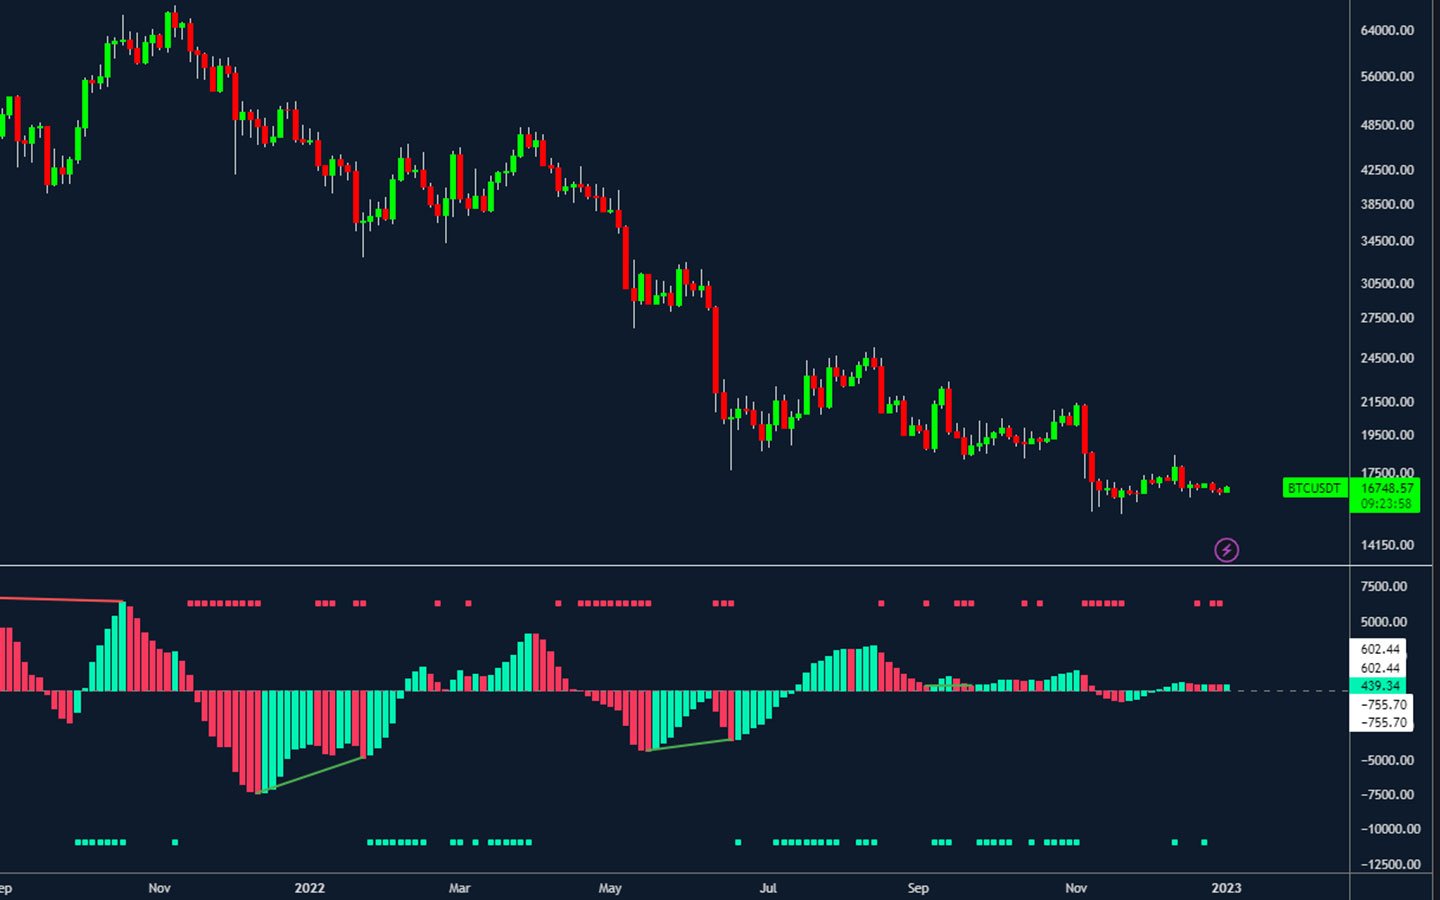
The Predator Momentum Oscillator (PMO) is a technical indicator that helps traders identify momentum trends and make more informed trading decisions. The PMO is an oscillator indicator that is intuitive for traders familiar with these types of indicators. Above the zero line, momentum is generally bullish, while below the line, momentum is generally bearish. The red bars on the histogram indicate declining momentum, while green bars show that momentum is increasing. This makes it easy for traders to quickly identify trends and make more informed trade decisions.
The PMO works best when used in conjunction with our Predator indicator, as they are designed to complement each other.
In addition to identifying trends, the PMO can also be used as a risk management tool.
In summary, the Predator Momentum Oscillator (PMO) is a powerful technical indicator that can help traders identify trends and make more informed trading decisions. By using the PMO in conjunction with the Predator indicator and as a risk management tool, traders can gain a deeper understanding of the market and achieve their trading goals.
Terminator
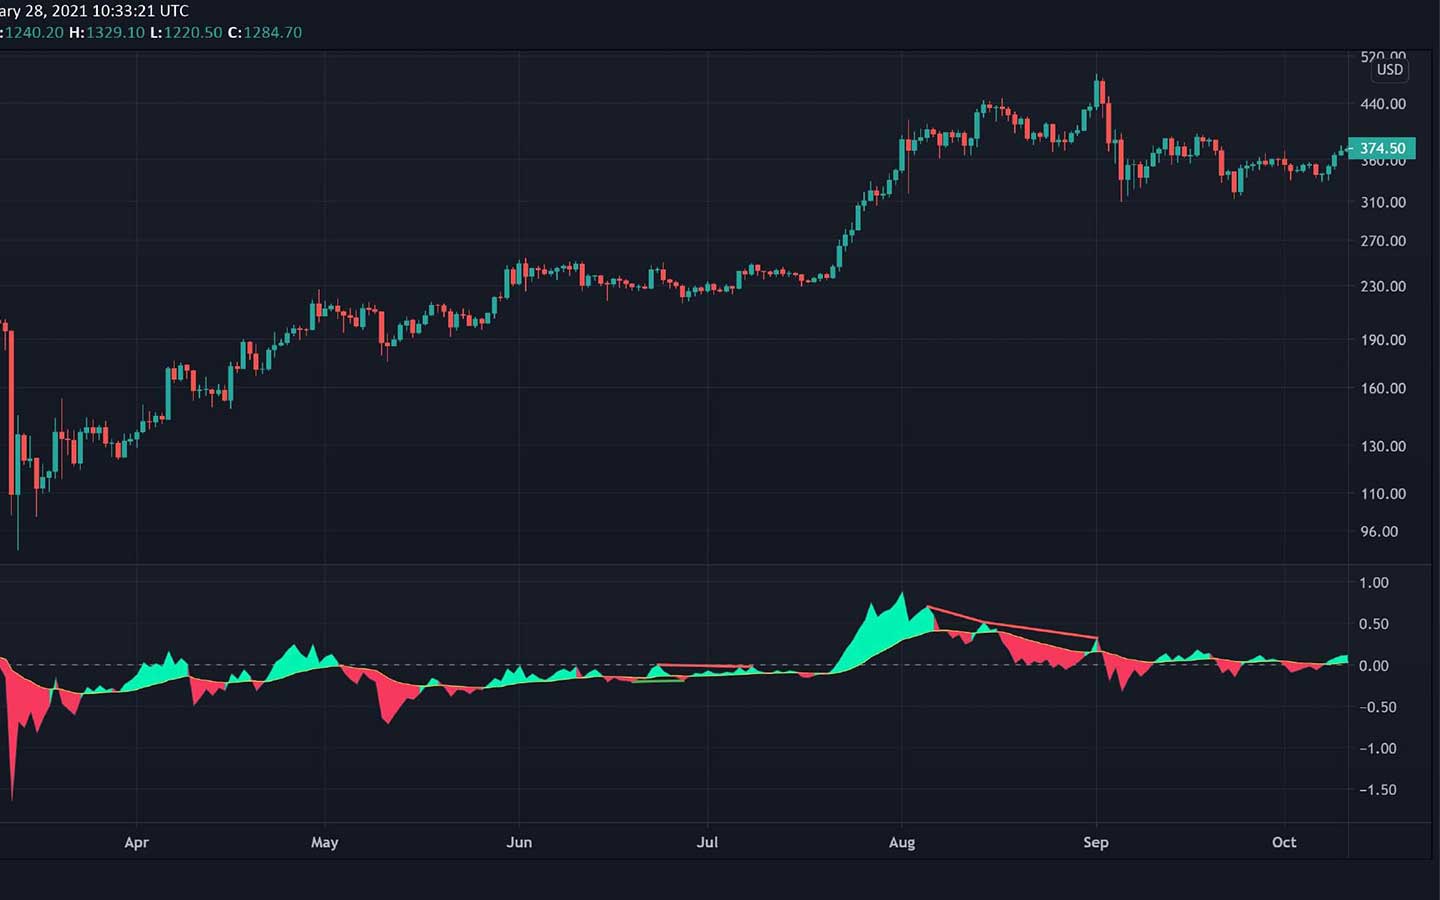
Terminator is a powerful technical indicator that is designed to help traders optimize their trade entries and exits. This indicator is volume-based, meaning it takes into account the volume of a particular security or asset when determining its value. Additionally, the Terminator includes divergences, which are used to identify potential trend changes and signal potential buying or selling opportunities. This combination of volume-based analysis and divergence analysis makes the Terminator a valuable tool for traders looking to maximize their profits and minimize their losses. With the Terminator, traders can gain a deeper understanding of the market and make more informed trading decisions, ultimately leading to a more successful trading experience. Whether you're a seasoned pro or just starting out, the Terminator is an indicator that can help you achieve your trading goals.
VWAP and TWAP bands
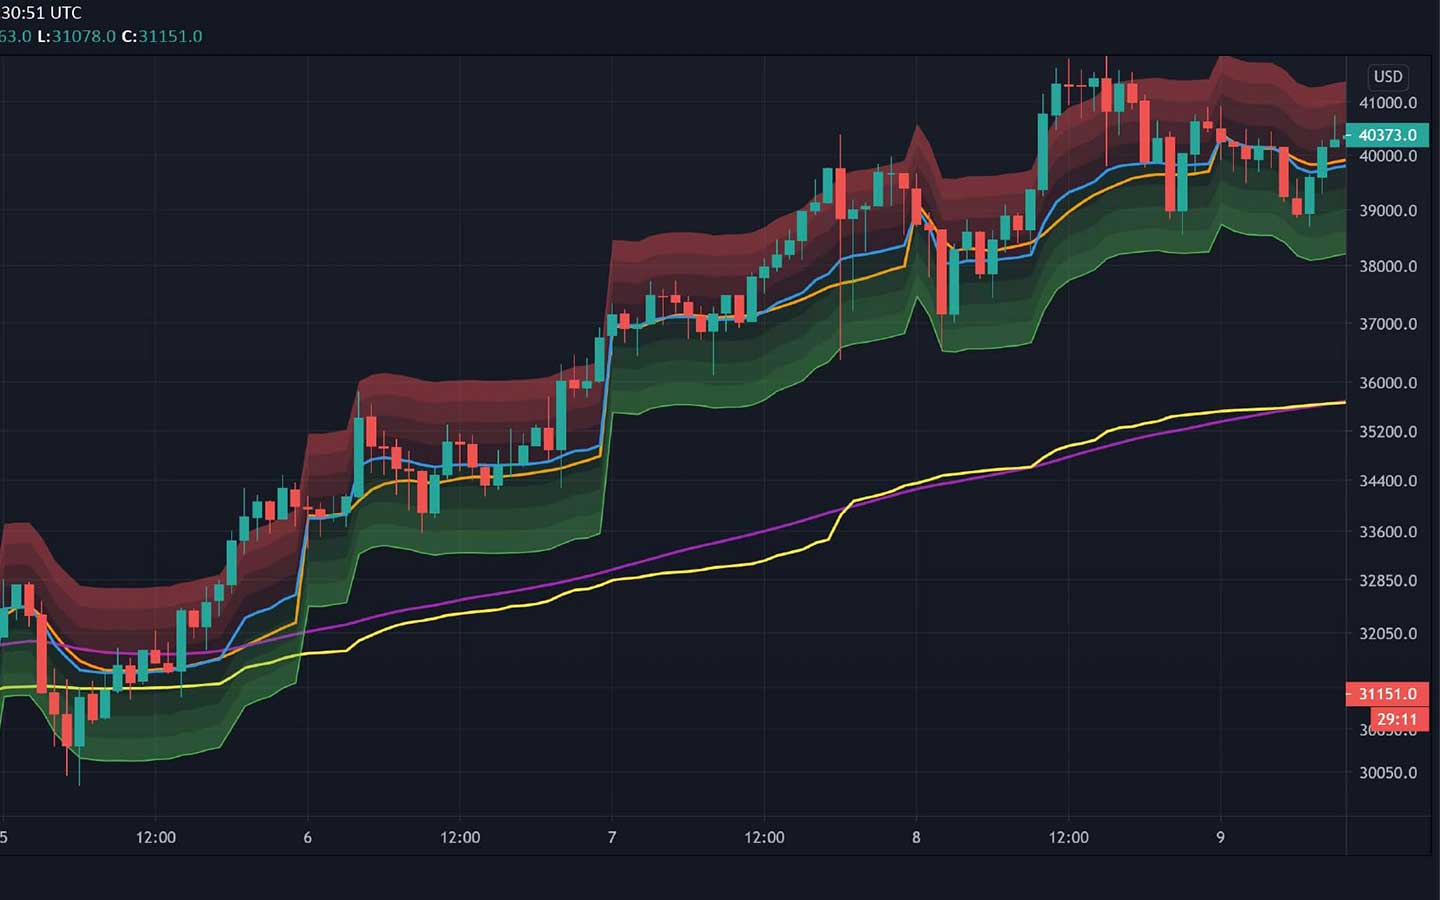
The VWAP and TWAP bands are a highly effective scalping tool that utilizes volatility bands to identify strong trade entry levels. This tool is based on the concepts of Volume Weighted Average Price (VWAP) and Time Weighted Average Price (TWAP), which are commonly used in the financial markets to measure the average price of a security or asset over a specific period of time. The VWAP and TWAP bands indicator uses these concepts to create volatility bands that can be used to identify potential buying or selling opportunities.
One of the key advantages of using the VWAP and TWAP bands is that it can help traders identify accumulation algorithms in popular cryptocurrencies such as Bitcoin (BTC) and Ethereum (ETH) during bull trends. This can be a valuable tool for traders looking to capitalize on these trends and maximize their profits. Additionally, the VWAP and TWAP bands can be used in conjunction with other technical indicators and analysis tools to provide a more comprehensive view of the market and help traders make more informed trading decisions.
Overall, the VWAP and TWAP bands are a valuable tool for traders of all experience levels looking to improve their scalping strategies. Whether you're a seasoned pro or just starting out, the VWAP and TWAP bands can help you identify high-probability trade entry levels and improve your chances of success in the financial markets. With its effective volatility bands, this tool can help you get more out of your trading strategies and achieve your trading goals.
Liquidity And SFP
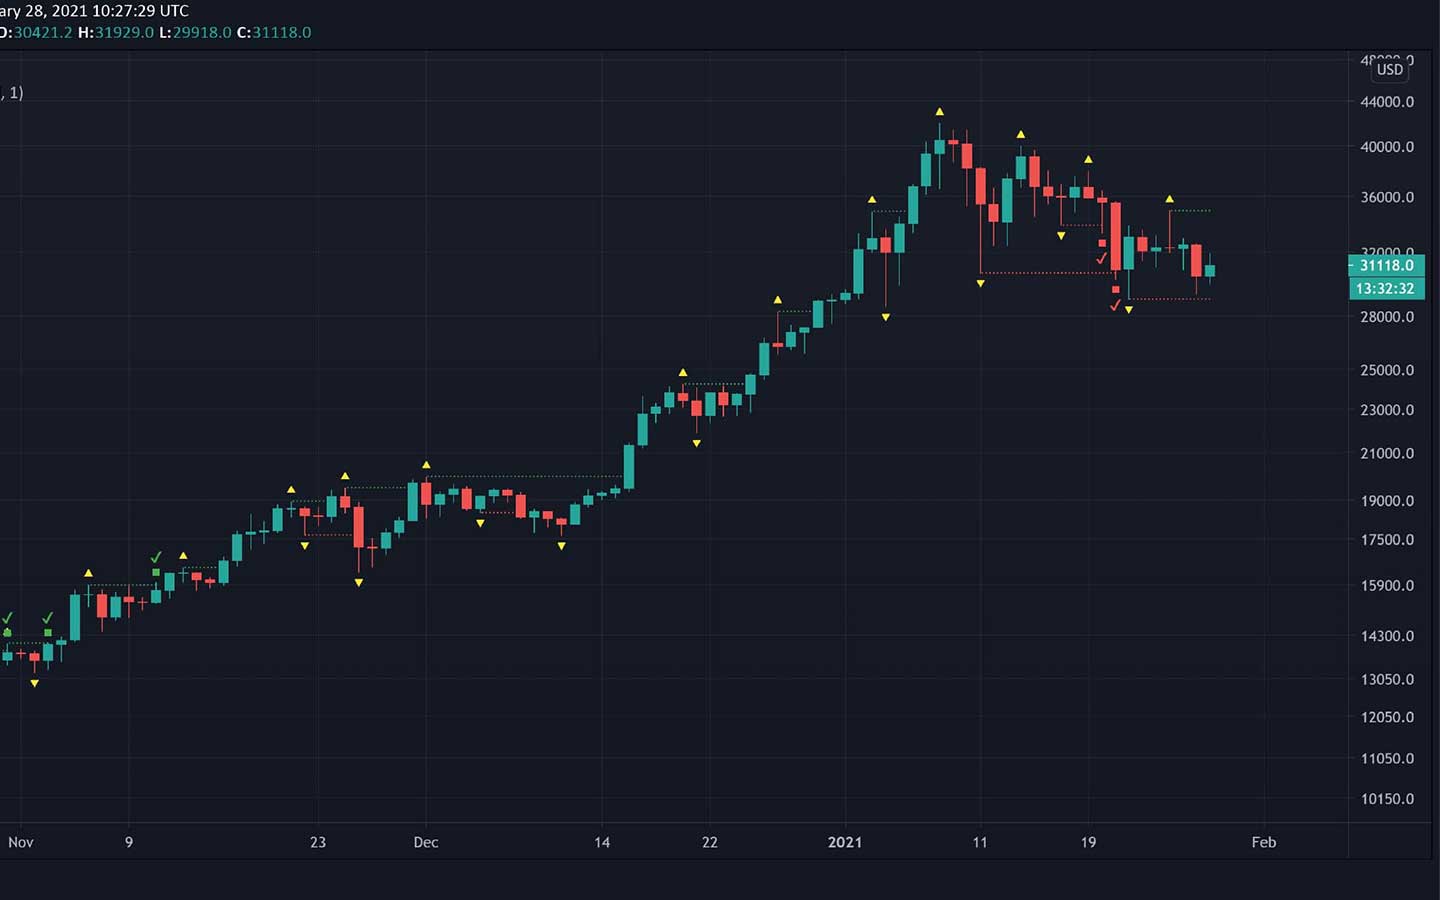
The Liquidity and Swing Failure Pattern is a powerful technical analysis tool that helps traders identify where pools of liquidity are likely sitting and targeted for stop runs. This pattern is particularly useful for traders who are looking to enter or exit the market at the most opportune times.
The Swing Failure Pattern is particularly useful for traders who are looking to capitalize on short-term market movements and make quick profits. One of the key advantages of using the Liquidity and Swing Failure Pattern is that it can help traders identify key levels of support and resistance. By identifying these levels, traders can make more informed trading decisions and potentially avoid costly mistakes. Additionally, this pattern can also be used in conjunction with other technical analysis tools and indicators to provide a more comprehensive view of the market and improve the accuracy of trade decisions.
Overall, the Liquidity and Swing Failure Pattern is a valuable tool for traders of all experience levels who are looking to improve their trading strategies and achieve their trading goals. Whether you're a seasoned pro or just starting out, this pattern can help you identify key levels of support and resistance and make more informed trade decisions. With its ability to identify pools of liquidity and targeted stop runs, this tool can help you maximize your profits and minimize your losses in the financial markets.
Macro Indicators for Bitcoin
In addition to trading tools that can be used across any asset, the DecenTrader Toolkit also contains four Bitcoin Macro Indicators that can be viewed within Tradingview.
They help to identify where $BTC is in its market cycles and whether high time frame conditions are bullish or bearish.
Puell Multiple: examines miner revenues to highlight cycle highs and lows.
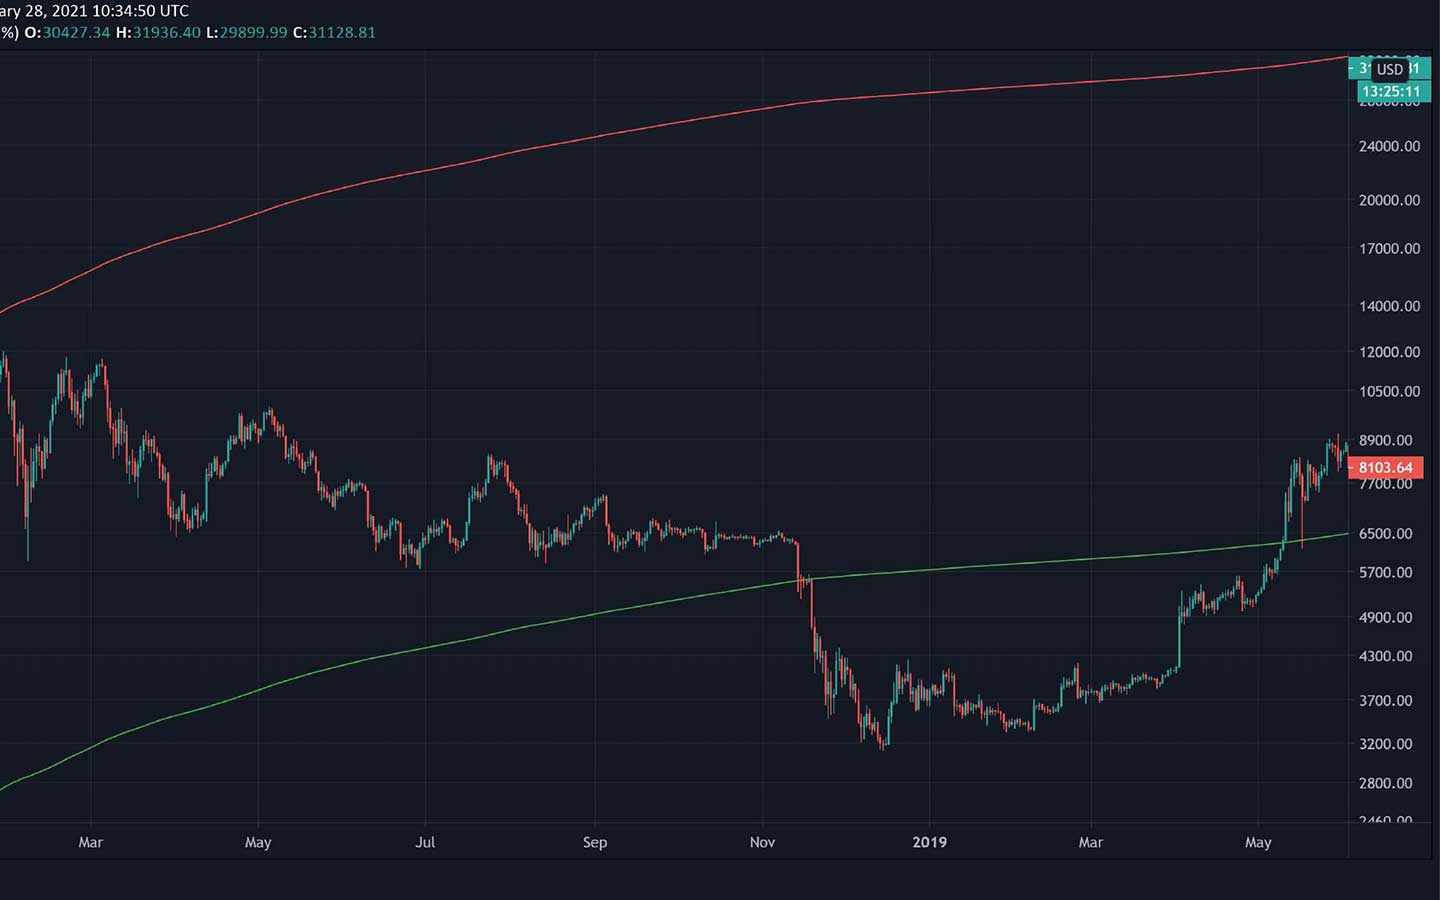
Bitcoin Investor Tool: shows when Bitcoin is significantly over or undervalued on a relative basis.
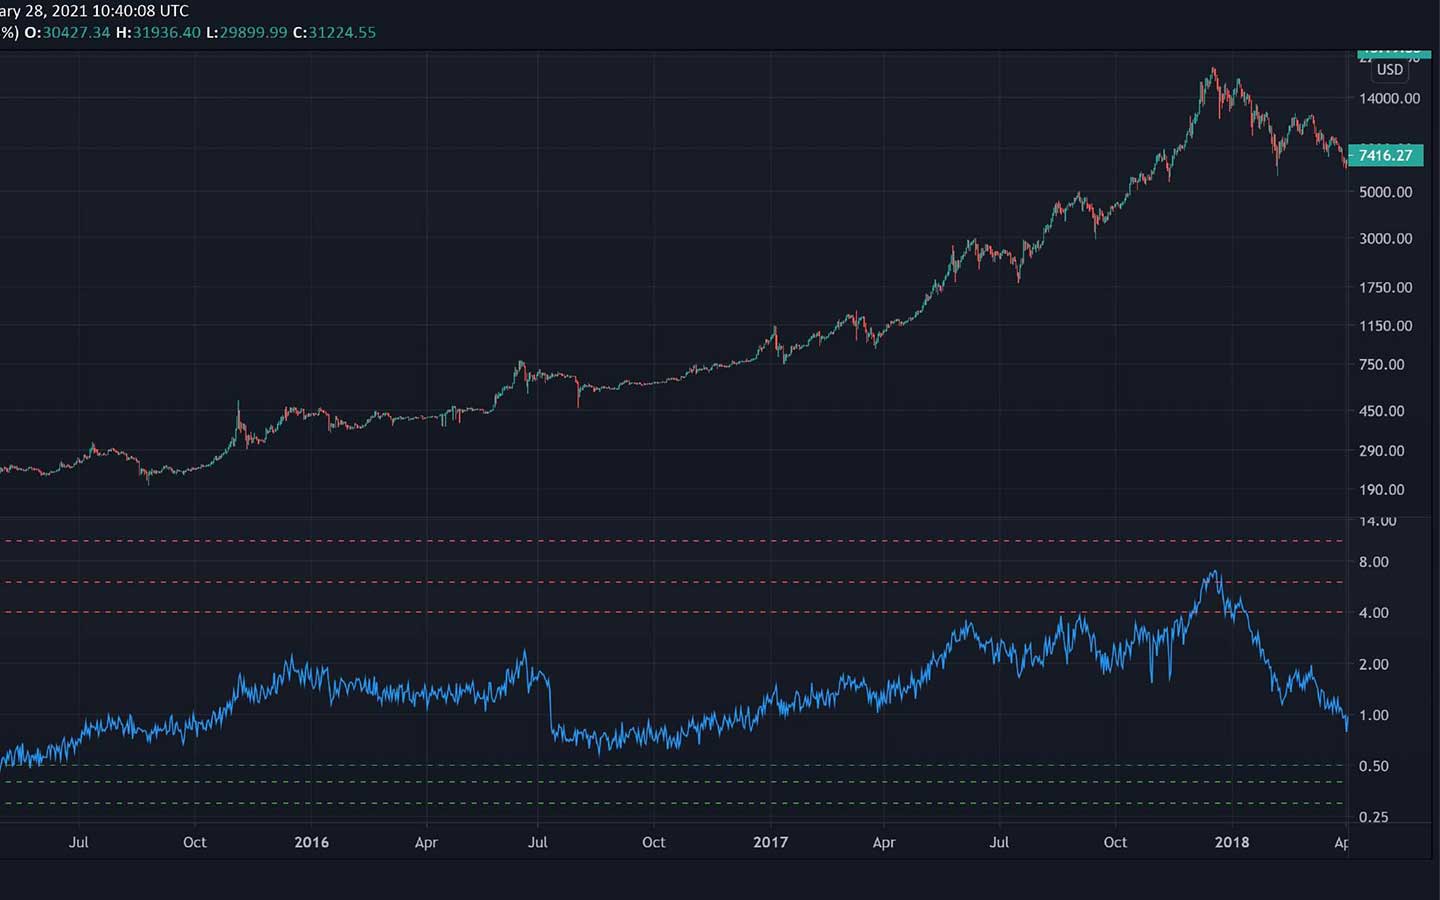
Golden Ratio Multiplier: risk management tool that highlights when the $BTC bull market is becoming overheated both mid and end cycle.
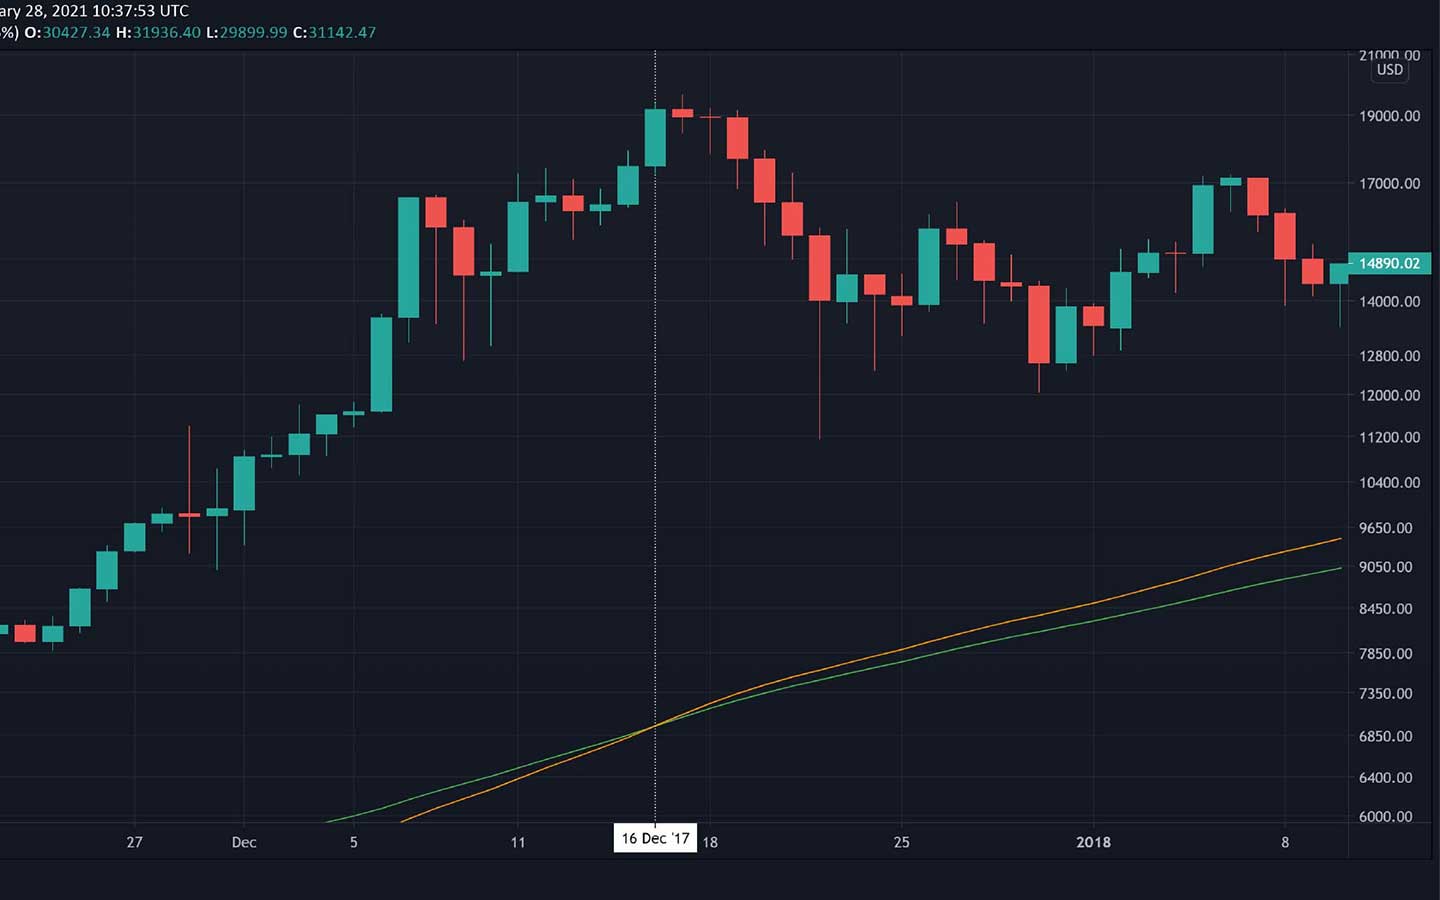
Pi Cycle Top: Identifies major cycle highs.

Buy lifetime access to the DecenTrader Toolkit
A suite of seven premium trading tools designed for a wide range of trading conditions.


