SFP Tool:
The purpose of the Liquidity and SFP (Swing-Failure Pattern) tool is that it looks for where there is weakness or point of interest in the price of an asset. A SFP is formed when price has fallen below a critical point in the market, and there is likely to be liquidity there. In the example below, on the 26th of June, there was a high and price reversed from there.
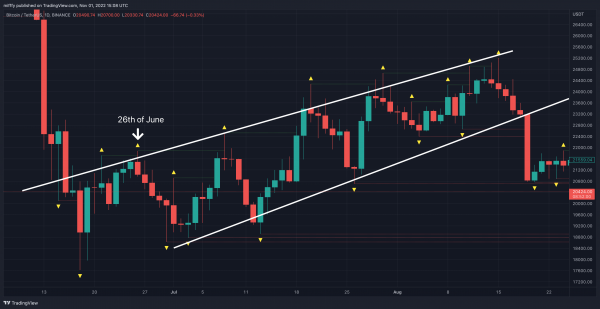
That point then becomes the Swing High of that price action. This makes it likely that there are stops held above that level. The SFP tool plots a line forwards to highlight this important area. On the 8th of July, price went across the previous Swing High which will have triggered some stops and potentially some momentum buy orders. This allows large players in the market, who may want a change in direction, to fill their short orders or sell orders into the liquidity.
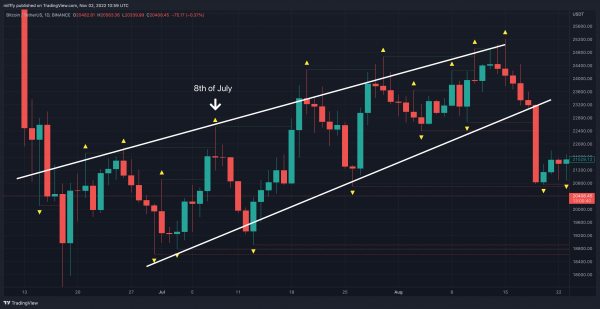
We can see that price did wick up to this area of liquidity, but the candle ultimately closed below it. This suggests there will potentially be a reversal in the trend direction. The dotted line marking the swing high will plot automatically, provided that in settings Line is checked.
Terminator:
Terminator is a volume and momentum based indicator. It’s most effectively used by identifying divergences, for example where price has moved lower, but the indicator has produced a higher low. This shows that despite price going down, volume momentum is to the upside, more so than it was previously, showing a divergence. The other side of the coin is that it could show a bearish divergence like in the example below.
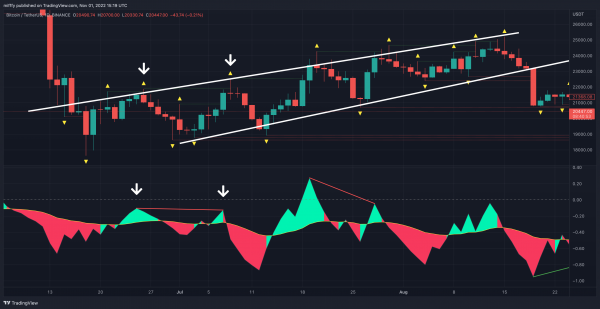
Used in confluence with the SFP tool, you can see between the two swing failure points, not only was the terminator yellow line below zero (which is generally bearish), we also had a lower high which shows a weakness in that push higher. The bullish and bearish divergences are automatically plotted, with bullishness in green and bearishness in red. If you are trading more cautiously, you would wait for Terminator to roll over and fall below the yellow Terminator line, rather than waiting for a bearish divergence to print.
Liquidity Tool:
The Liquidity tool has both long and short predicted liquidation levels, at the key x3, x5 and x10 liquidation levels. Historically, when price has entered these levels we have seen an escalation in the move as positions are either liquidated or stops are triggered. Generally, the 4 hour time frame is the best for using this tool. Furthermore, it works best on a clear chart due to the amount of prints on TradingView.
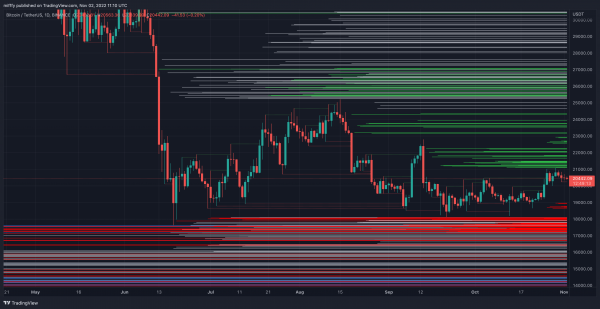
The areas of high liquidations count are price levels with significant liquidity, that typically the market will trend towards. It is important to note that each bar does not represent an exact number of liquidations, but is a count relative to the other liquidation levels. Therefore it shows how likely it is that the market will be affected by the liquidations and liquidity there. Price action will often tend to trend towards large areas of liquidity as this is where whales in the market are able to sufficiently fulfill their orders. Once a large liquidation level or cluster of levels has been cleared, this can often market a local top or bottom.
V&TWAP Tool:
Standing for Volume and/or Time Weighted Average Price, it is a weighted moving average, that is weighted by either volume or time. This will begin and end at the start and close of the trading session, typically the daily or weekly. This is important as often it is used to determine what is a good value price for entry for the trading session. Price is often quoted as the latest price, but this could be a large wick with little volume and time traded at the extreme top of the wick. In previous bull markets we have seen whales in the market using V&TWAP to buy quickly into a quickly trending market. A very bullish market would front run even what is considered to be a fair value price.
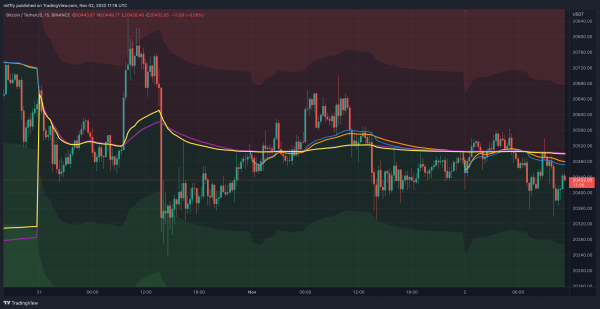
The bands come with deviation bands. The further price enters these bands, the greater the probability that price will revert back to the V or TWAP line. This is why the tool can be exceptionally useful for short time frame scalp traders.
Watch how Filbfilb uses the tools in the below video!
Disclaimer: Nothing within this article should be misconstrued as financial advice. The financial techniques described herein are for educational purposes only. Any financial positions you take on the market are at your own risk and own reward. If you need financial advice or further advice in general, it is recommended that you identify a relevantly qualified individual in your Jurisdiction who can advise you accordingly.


