NFT King is designed to be simple and intuitive, to provide alpha to NFT collectors of every experience level. To begin we start with three clean tables:
- Top 50 collections
- New Bullish collections
- New Bearish collections
NFT King currently only includes the Top 50 collections, as these provided sufficient data and volume for the complex algorithms we built to be fully tested and optimised. Rest assured we will be adding more collections soon!
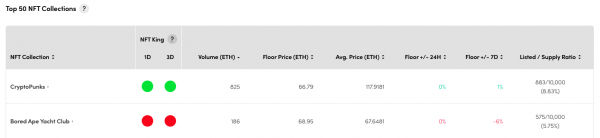
The first table, which includes the full collection of projects, allows you to quickly scan the projects ordering them low to high or vice versa across a variety of metrics, such as floor price, change in floor price, volume and list/supply ratio. To dive in deep to a project, simply click on it to open up in-depth analytics.
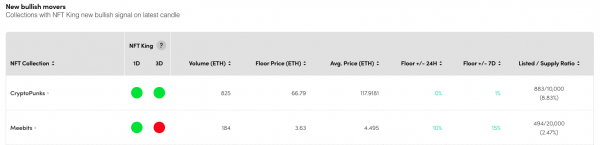
If you’re looking to snipe yourself a new profile picture, the New Bullish collections table is what you’ll be interested in. This shows the collections that have just turned green on either the daily or three day time frame. Using our algorithm, this suggests that these collections have an outsized probability of trending higher, which is noted by green for go. Again, simply clicking on any of the collections will bring up further metrics.
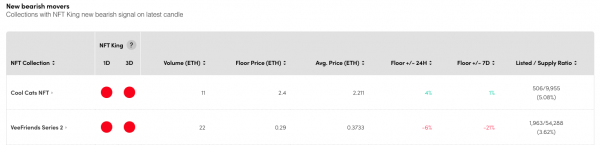
If you’ve found yourself bag holding a collection and are debating when to exit, then the New Bearish collections is the table for you! Here you can see collections which our algorithm suggests are bearish and are at risk of trending lower. Again, this is clearly marked as red for stop. This cuts out the emotion and has helped our algorithm to dramatically outperform a buy and hold strategy over time across the top 50 NFTs!
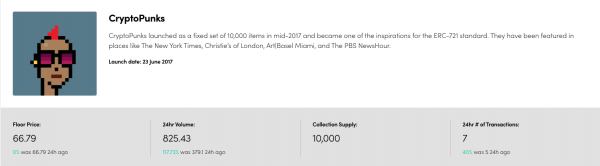
When breaking a collection down further, the first thing we’re presented with is an overview and description of the collection. This includes a visual confirmation of the collection and floor price and volume showing their 24hr change.
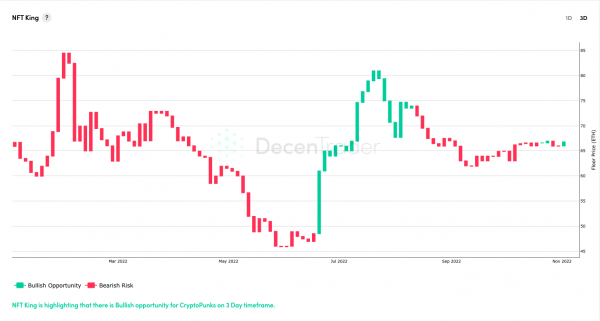
We then come to the chart showing the NFT King algorithm output overlaid on price. We think it speaks for itself. Chart can be adjusted between the daily and three day in the top right depending on whether you are looking to trade in and out of the collection on low timeframes (1 Day) or less frequently on higher timeframes (3 Day). Green good, red bad.
There are multiple ways that you can use NFT King:
– As a stand-alone trading tool consistently moving in and out of a particular NFT collection over time based on the NFT King output.
– Optimising a one-off entry or exit for a particular NFT.
– As an additional data point tool when analysing an NFT collection.
– Or any other way that suits your NFT investing!
Underneath the NFT King chart on the dashboard are a range of supporting data points that will be added to and updated over time. Let take a look at some of them…
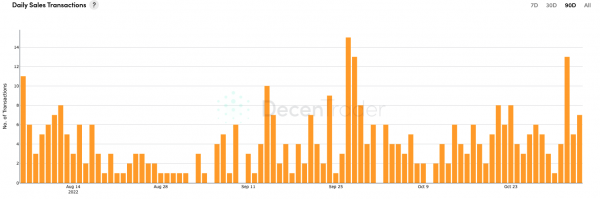
The easiest way to think about Daily Sales transactions is that it is very similar to volume in traditional trading. However, as the value of NFTs can vary wildly from their floor price, for example the most valuable NFT in a collection could be ten times the floor price. Under volume, ten floor price sales will register the same as the sale of the most valuable NFT. Sales transactions are the number of NFTs of the collection that have been sold, regardless of floor price. It is useful to know if a large number of NFTs are being dumped vs a high value one being sold.
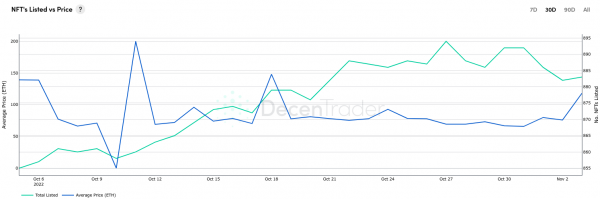
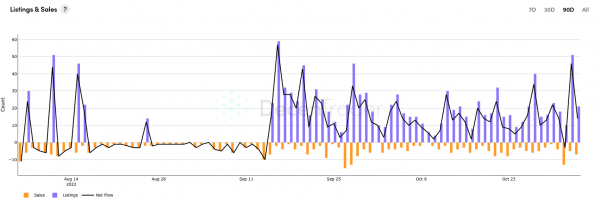
NFTs Listed vs Price is like having a crystal ball for holders intentions! Before someone can sell their NFT, they must list it therefore registering their intent to sell. If there is a sudden spike in listings, without an increase in the Daily Sales, this may be bearish for the collection as a large number of holders are wanting to dump. Inversely, if there are very few NFTs being listed and as soon as they are, they are being sold, the collection is clearly in high demand and may see the floor price increase over time. If price moves higher and there is a sudden spike in new listings, this could signal a local top as traders rush to take profit. The fewer listings there are as price increases, the greater the probability that the trend will continue.
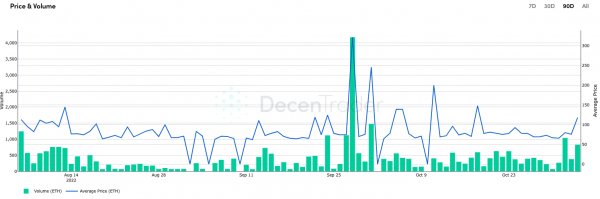
Hopefully all traders should already be familiar with the relationship between price and volume. Typically, we would want to see price increasing in tandem with volume to suggest the move is supported by volume as traders are still happy to pay the new higher price. It is worth noting that price is listed in ETH and therefore volatile swings in Ethereum price could have a slight bearing on this.
Listings & Sales are combined to make a new metric – Net Flow. This is the difference between the number of listings and the number of actual sales. Therefore, it functions as a proxy of market sentiment. A high Net Flow would generally be considered bearish as there are many people wanting to sell and few people interested in purchasing the NFTs. Likewise, the lower Net Flow is, the more bullish it is as traders are snapping up any NFTs that are listed.
Disclaimer: Nothing within this article should be misconstrued as financial advice. The financial techniques described herein are for educational purposes only. Any financial positions you take on the market are at your own risk and own reward. If you need financial advice or further advice in general, it is recommended that you identify a relevantly qualified individual in your Jurisdiction who can advise you accordingly.


