RSI stands for Relative Strength Index. It is a momentum oscillator which indicates the strength and direction of recent price action. RSI generates a value that oscillates between 0 and 100 by comparing the average profit and average loss over a set time frame (usually the previous 14 candles). Values above 50 would suggest an uptrend, with the strength of the momentum increasing as the value does. Below 50 would suggest a downtrend, with downwards momentum increasing as the value gets closer to 0.
If the momentum is higher than previous times price has tested a resistance level, this could suggest there is strength to break through the resistance. Likewise, if RSI is decreasing on each subsequent test of a support level, this could suggest that the support level will soon be lost.
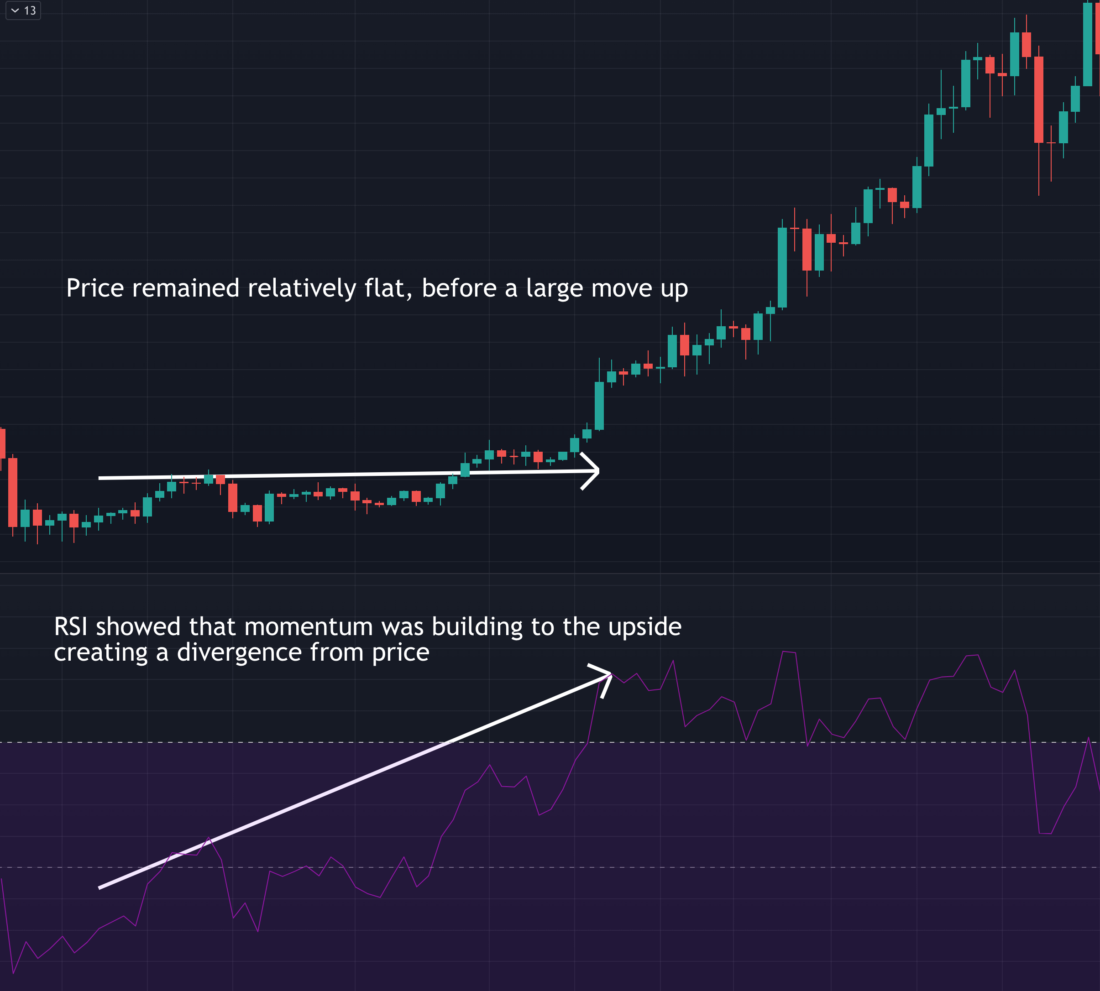
RSI is better used as a confirmation indicator to see how much momentum there is in a trend. As the momentum is beginning to change direction, this could indicate that a trend reversal is due. Therefore, the most effective way of using RSI is to identify divergences between price and RSI.
Disclaimer: Nothing within this article should be misconstrued as financial advice. The financial techniques described herein are for educational purposes only. Any financial positions you take on the market are at your own risk and own reward. If you need financial advice or further advice in general, it is recommended that you identify a relevantly qualified individual in your Jurisdiction who can advise you accordingly.


