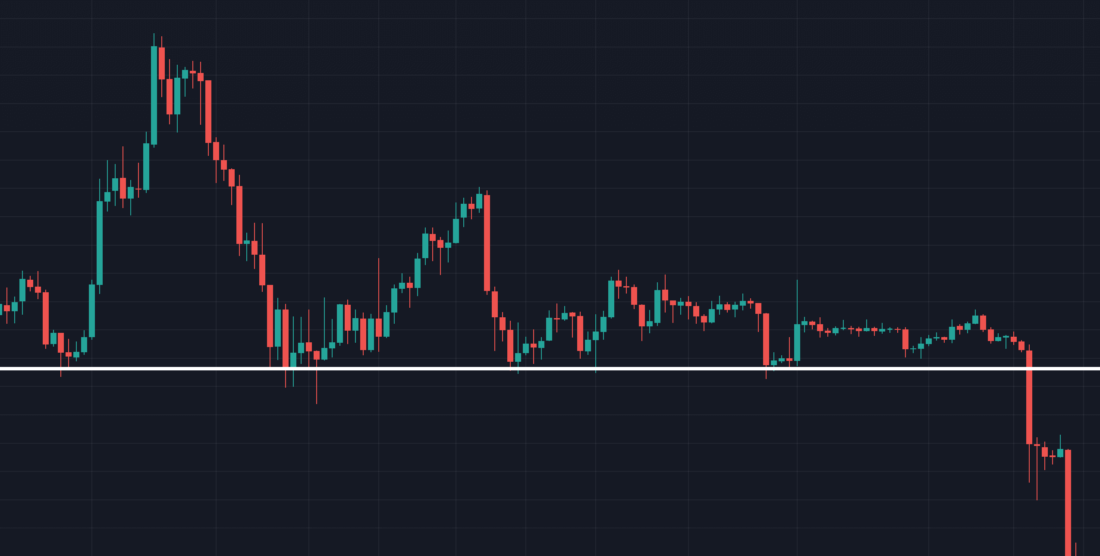
Support
Areas of support are zones that have historically reversed downward trends. This means that typically there is a greater volume of buying than selling in this area. More recent price action is more relevant when determining areas of support. The more an area of support is tested, generally the weaker it becomes as the buying pressure decreases. This would be shown with decreasing buying volume each time the price bounces off the support. Once the support is lost, a sharp sell off normally follows as can be seen in the chart below.
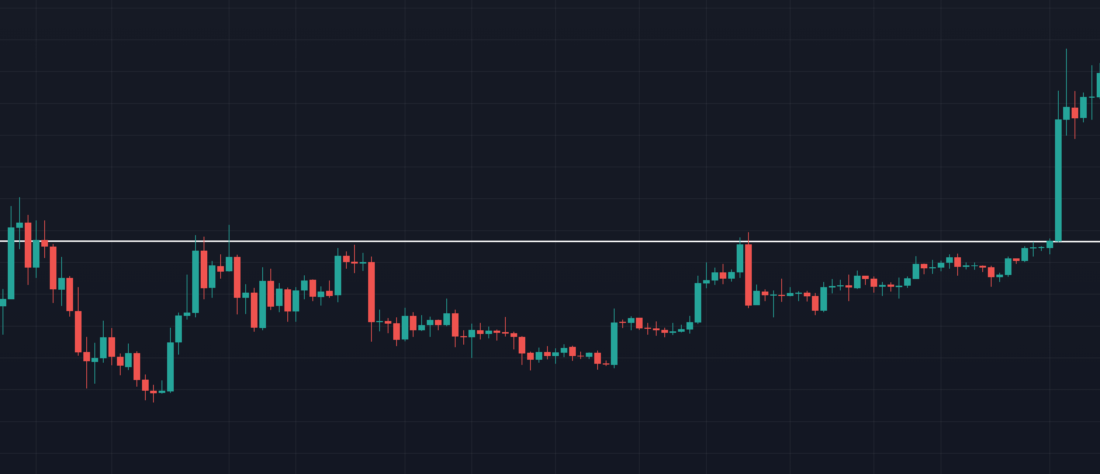
Resistance
Resistance levels are the opposite of support. Typically, an upwards trend reverses when it interacts with it. Normally, price will fail to convincingly close above a resistance level on the first attempt. However, as the selling pressure weakens from each subsequent test, the probability of a breakout increases. As you can see below, the sell offs from the resistance level weakened each time the resistance was tested. This was accompanied by decreasing sell volume and on the final test of the resistance, ended with a strong breakout to the upside.
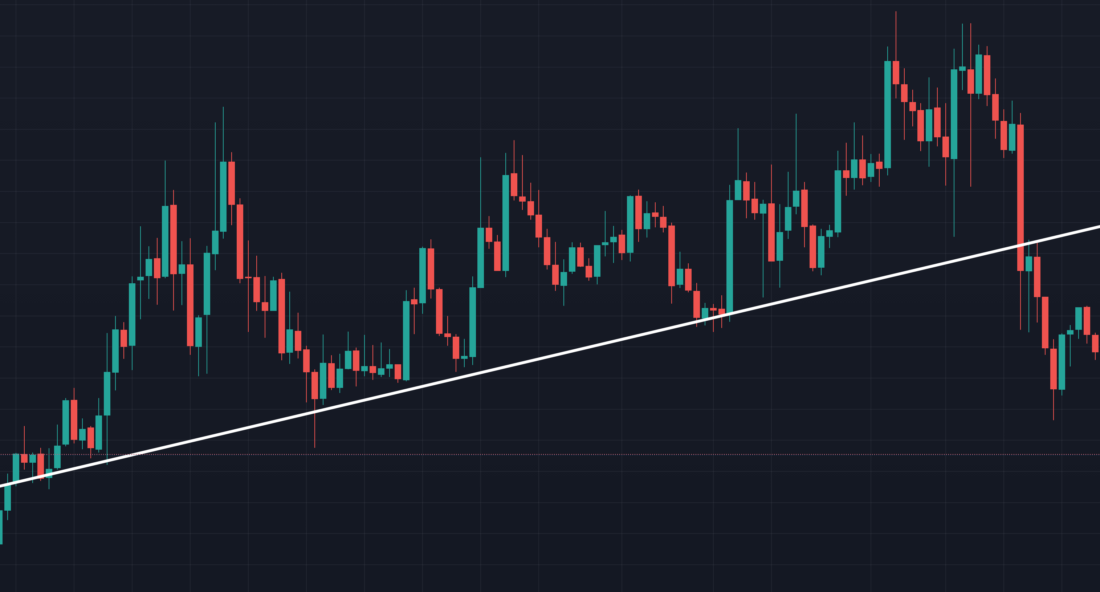
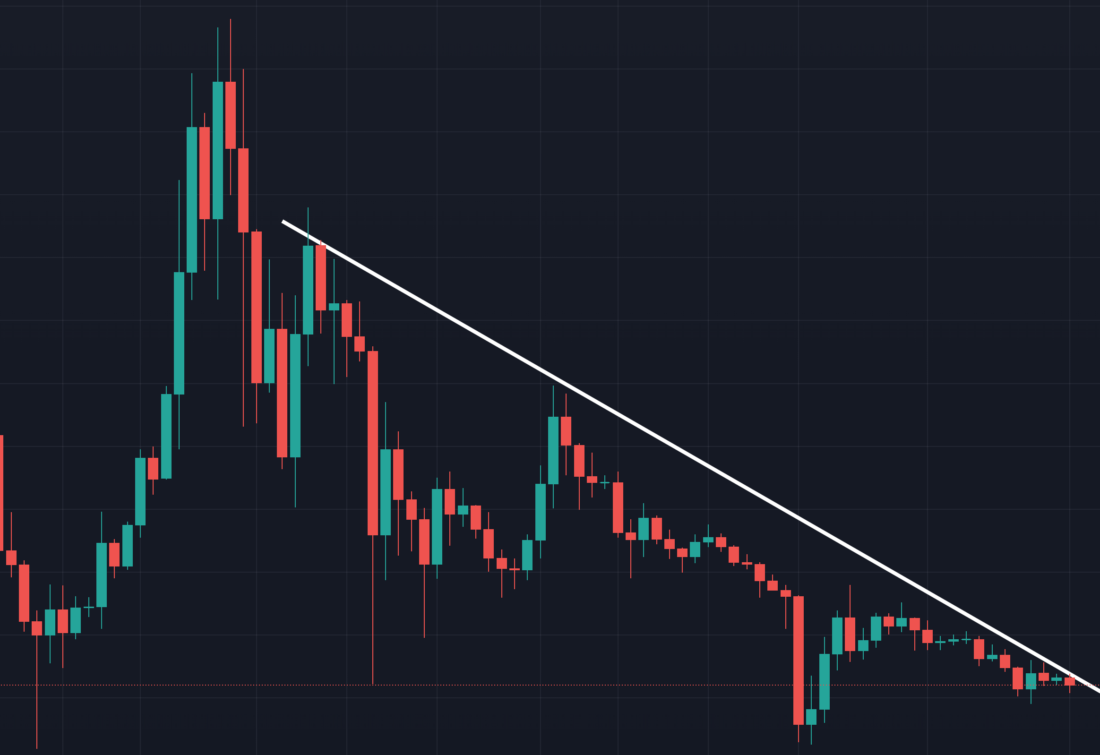
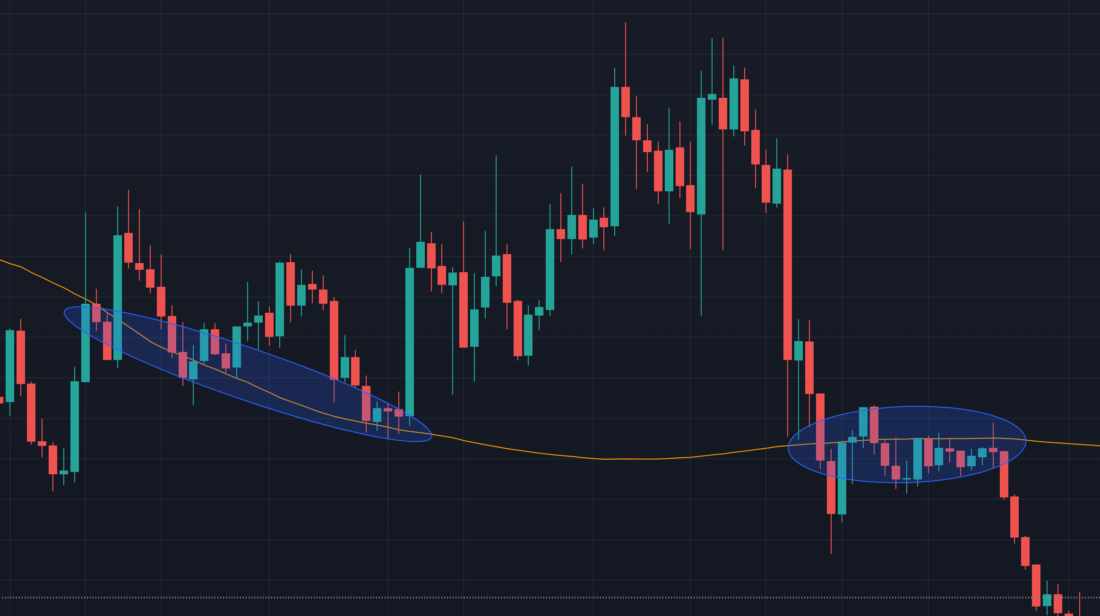
Acting as Support or Resistance
Support and Resistance levels do not necessarily need to be straight lines at a fixed price level. Trend lines, Fibonacci levels and moving averages to name a few, can all act as areas of both support and resistance.
Disclaimer: Nothing within this article should be misconstrued as financial advice. The financial techniques described herein are for educational purposes only. Any financial positions you take on the market are at your own risk and own reward. If you need financial advice or further advice in general, it is recommended that you identify a relevantly qualified individual in your Jurisdiction who can advise you accordingly.


