Bitcoin Chopping Up Front Runners Before The Move
The start of the new year has been challenging for Bitcoin. After breaking below and retesting the 200DMA, $BTC price continued its downtrend to $40k.
After a notable amount of bullish “I’m buying the dip” sentiment on CT around $41k, we saw this sentiment challenged as price then pierced the top of the summer range with a stop-hunting wick down to $39,700.
Since then $BTC has bounced up to $44k and is currently being rejected off that level.
It is our view that we may need to see some further ranging between $44,000 and potentially $38,000 before an eventual breakout. This ranging is likely to cause more pain and misery for any traders who try to impatiently front-run major moves before they are ready.
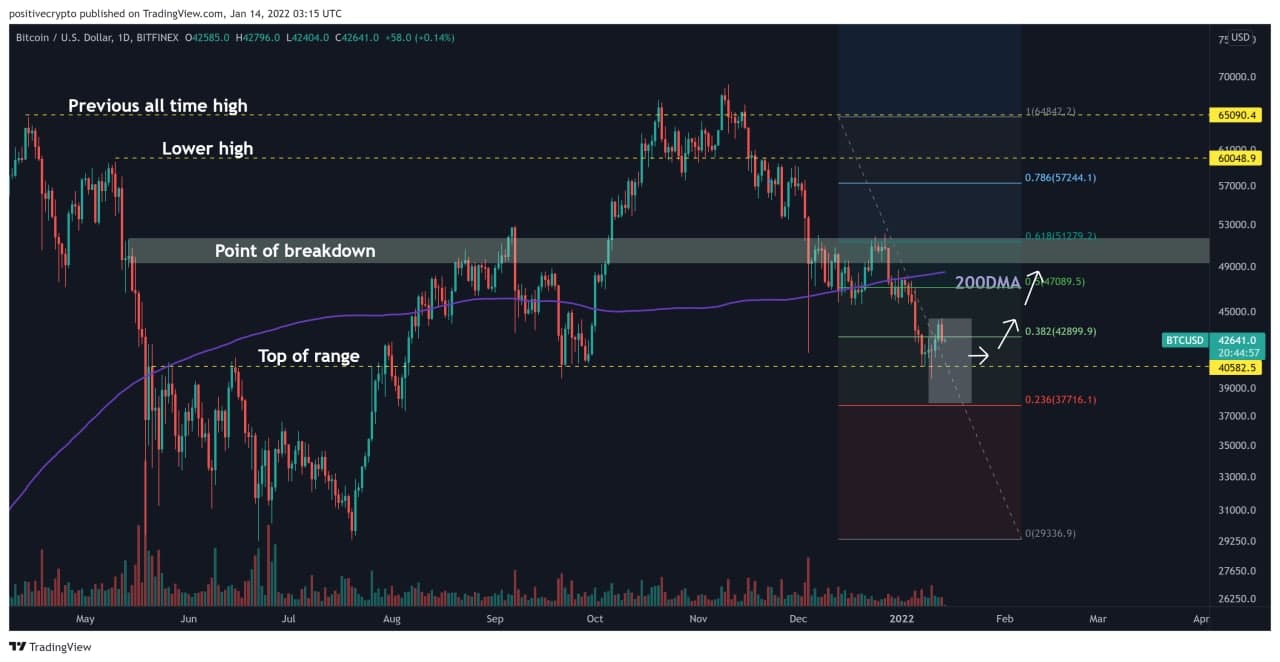
Figure 1: A potential range area forming on $BTC in the low $40k’s.
Given the current fundamentals of Bitcoin and the size and consistency of the downtrend over the past 2 months, we do believe that a move out of the range to the upside is the most probable outcome eventually.
Even if such a move were merely a relief bounce, we would expect it to run towards the 200DMA and the point of breakdown in the summer at around $49,000 – $50,000. That would be an area we would then be closely monitoring for potential rejection or continuation.
Funding
We believe a key reason why a major squeeze move has not played out yet is because there has not been sufficient negativity to squeeze.
For much of the past few weeks, funding rates have remained stubbornly flat. It is only over the past few days that we are starting to see consistent negative funding. But for a major squeeze to the upside to happen, we expect more time ranging with negative funding before the probability of that squeeze increases.
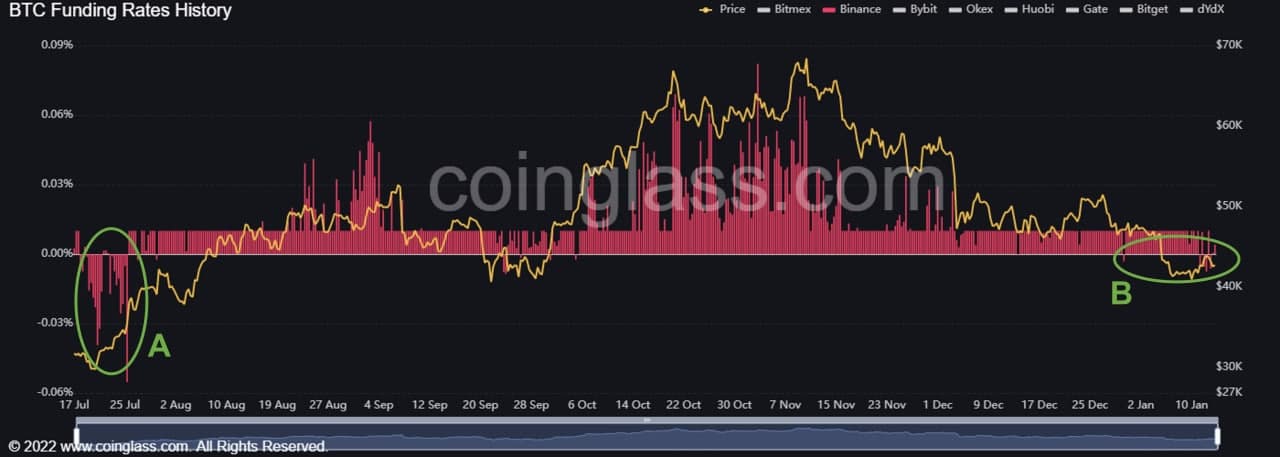
Figure 2: Funding rates are only just starting to flash negative. Source: coinglass.com
This lack of consistent negative funding is in contrast with the summer breakdown where we had large periods of negative funding. While they do not need to reach such levels, we may just need a bit more than we currently have before we can achieve any meaningful squeeze.
Note that the chart above focuses on Binance as that is where a significant share of the market volume is taking place. We, therefore, place greater importance on funding rates there vs smaller volume exchanges.
Predator Across Timeframes
Looking across Predator timeframes shows the current predicament with a lack of strength to the upside resulting in a mostly bearish trend indication.
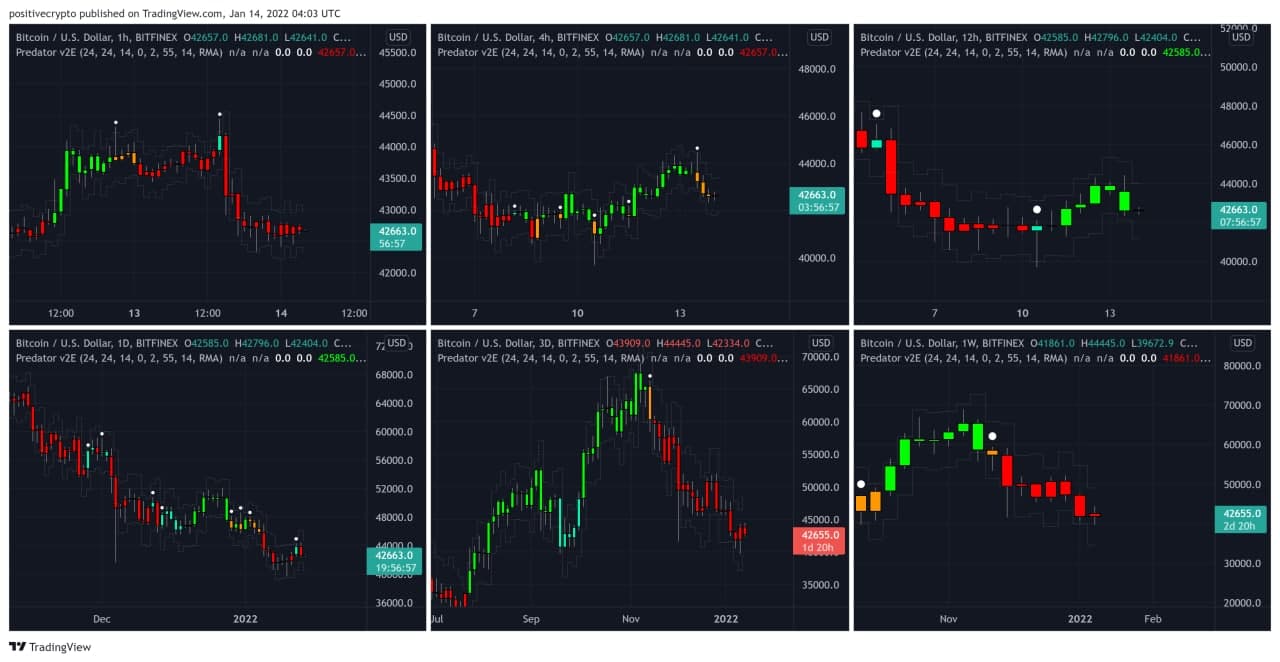
Figure 3: Predator Cross Timeframes
Trend summary:
1hr: Bear
4hr: Bear
12hr: Bull
1D: Bear
3D: Bear
1W: Bear
At the time of writing, only the 12hr is signaling bullish, all other timeframes are bearish. Traders looking to ride a trend of strength may need to be patient right now in this range to avoid getting chopped up.
Downside risk
It is notable that Longs are steadily increasing. The chart below shows a similar pattern that played out in the summer crash where a sharp move to the downside cleaned out a significant number of longs.
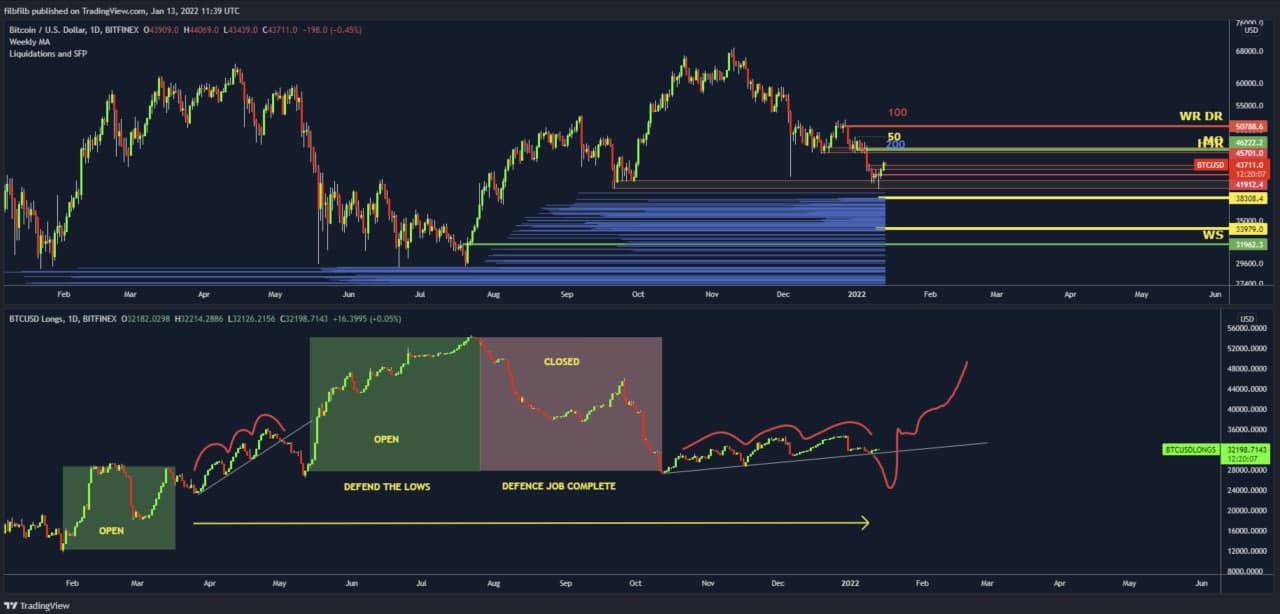
Figure 4: Longs steadily building over time.
Should this play out then the $38,000 area will be an important one to watch. Using the Predator Pack Liquidity Tool we are able to see where a large amount of 3x long stops are positioned and could be taken out (blue lines on the chart above). Price trading much below that $38,000 level could cause a sharp move down to $32,000 where there is strong structural support.
Near term upside levels
If the bulls can muster up the strength to move the price up, once $BTC breaks $44k which is currently forming the top of a new range, the next target level is $46,000 which we would expect to be stubborn resistance.
Beyond that level, the 50 / 200DMA “death cross” is forming and will cross in the next 48hrs. Historically, price has briefly dropped after these death crosses before then rallying soon after.
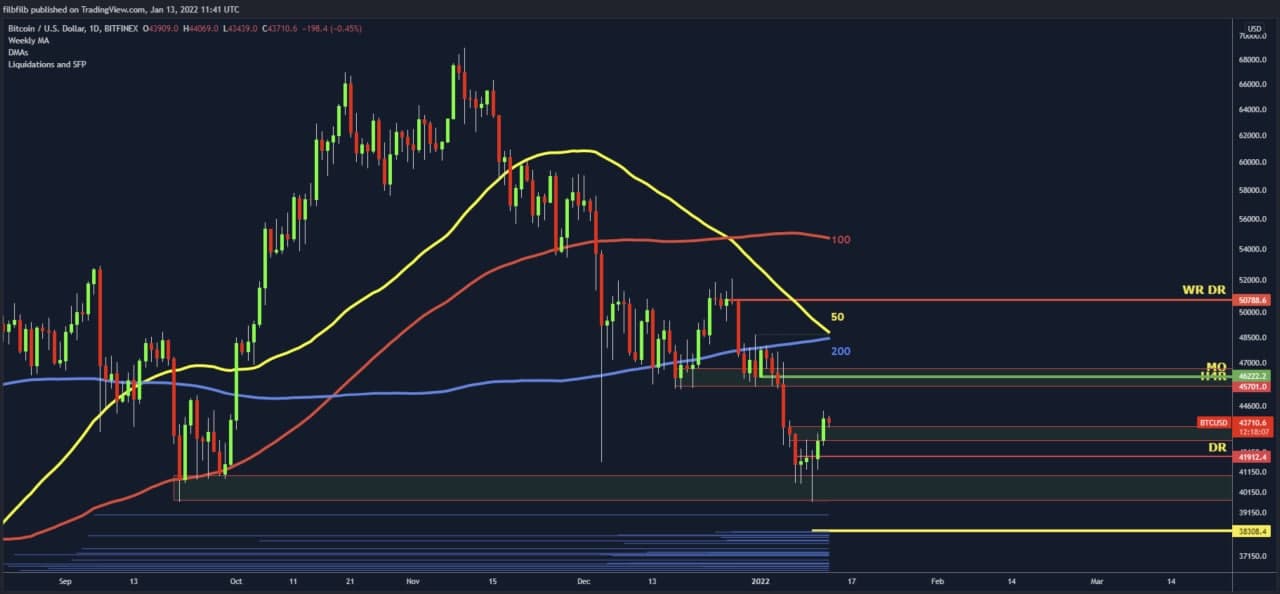
Figure 5: 50DMA and 200DMA “Death Cross” forming.
Unwavering HODL’ers
Zooming out to look at the longer-term picture, the 1yr HODL wave continues to be one of the most startling data points in crypto right now. Despite the recent price downtrend, we are seeing the percentage of bitcoin that is HODL’ed for at least a year actually increase significantly. The 1yr HODL wave line is now sitting at 59%.
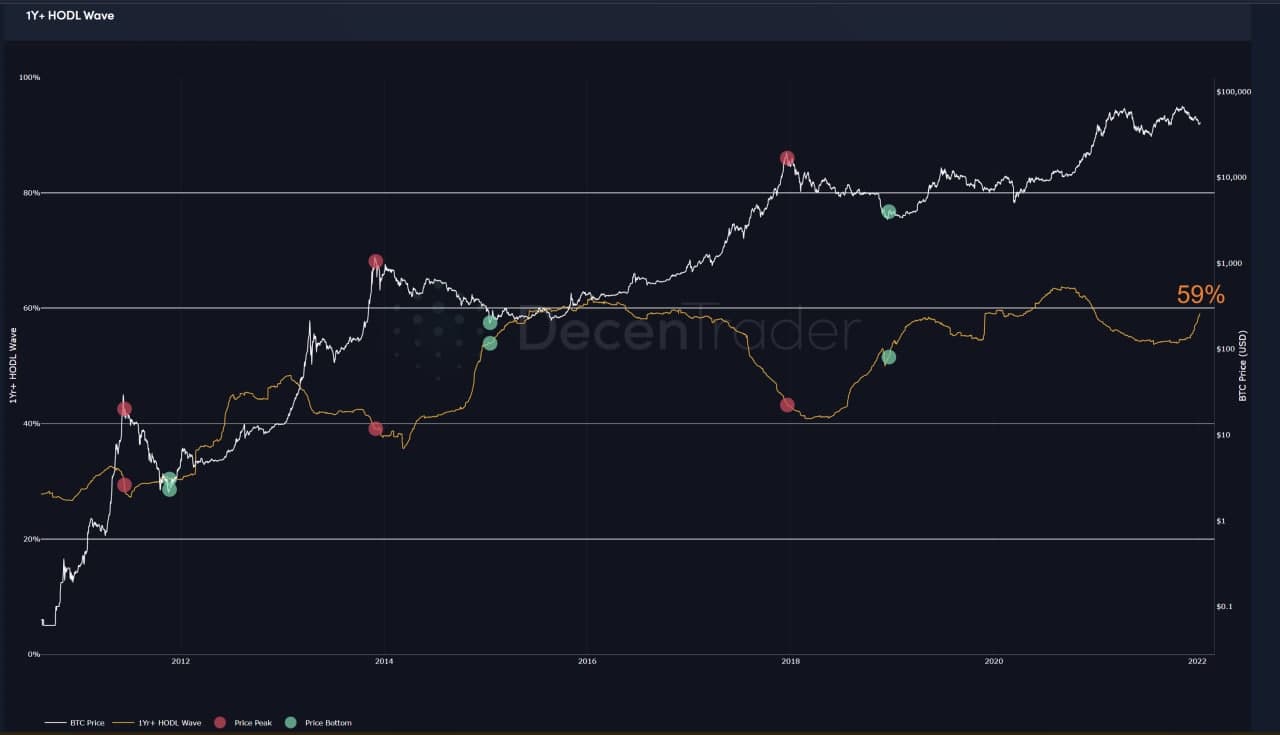
Figure 6: 1yr HODL Wave now at 59%.
If / when the next surge of demand for Bitcoin kicks in, this is likely to have a major impact as long-term supply will be very limited which could cause price to appreciate rapidly. This is because these long-term hodl’ers have shown that they are prepared to sit on their hands before realizing profits, and are most likely not intending to take profits this side of $100,000.
Conclusion
So while we expect Bitcoin to have a very strong 2022, in the near term those anticipating a short squeeze may require further patience until we see more evidence that the conditions are right for such a move to play out. Until then, a possible move into the $38,000 area remains on the table.
Disclaimer: Nothing within this article should be misconstrued as financial advice. The financial techniques described herein are for educational purposes only. Any financial positions you take on the market are at your own risk and own reward. If you need financial advice or further advice in general, it is recommended that you identify a relevantly qualified individual in your Jurisdiction who can advise you accordingly.


