Bitcoin’s Rising Tide – Market Update
Bitcoin remains trapped within the macro range it has now sat since January of 2022. After a swift move up on Monday morning, Bitcoin broke the 50 DMA and found itself being rejected off both the 100 DMA and middle of the range, in a similar fashion to what occurred in the bottom consolidation in August of 2021.
High Time Frame Analysis
There was a lot of speculation around the impact of the Russian – Ukraine conflict and flight to safety around this move, I will discuss thoughts on that later.
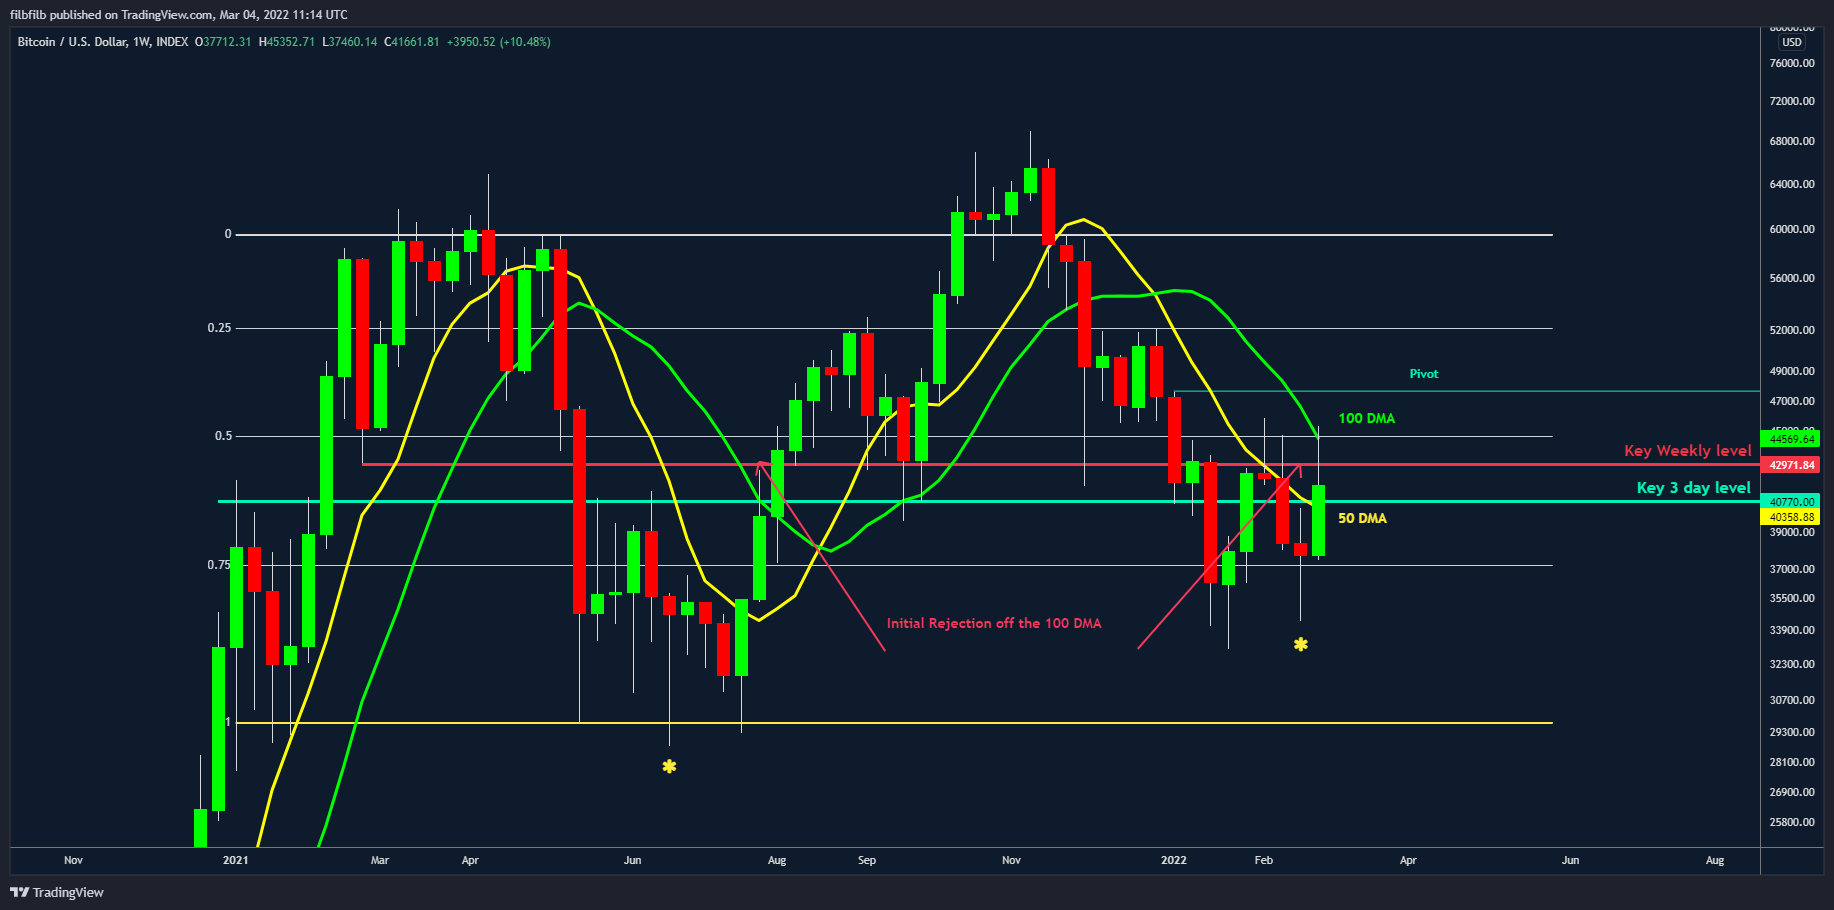
Figure 1. Bitcoin 1 Week Chart range with 50 & 100 DMAs
Looking at the 3-day chart alongside the Predator indicator, we can identify a key level that acts as support and resistance, which is being backtested at the time of writing. Predator is green and above the 50 DMA, however, history tells us that the best time for continuation occurs when the weekly closes above the 50 DMA alongside a green 3 day candle. Therefore, the $40.5k level is of immediate importance going into the weekend.
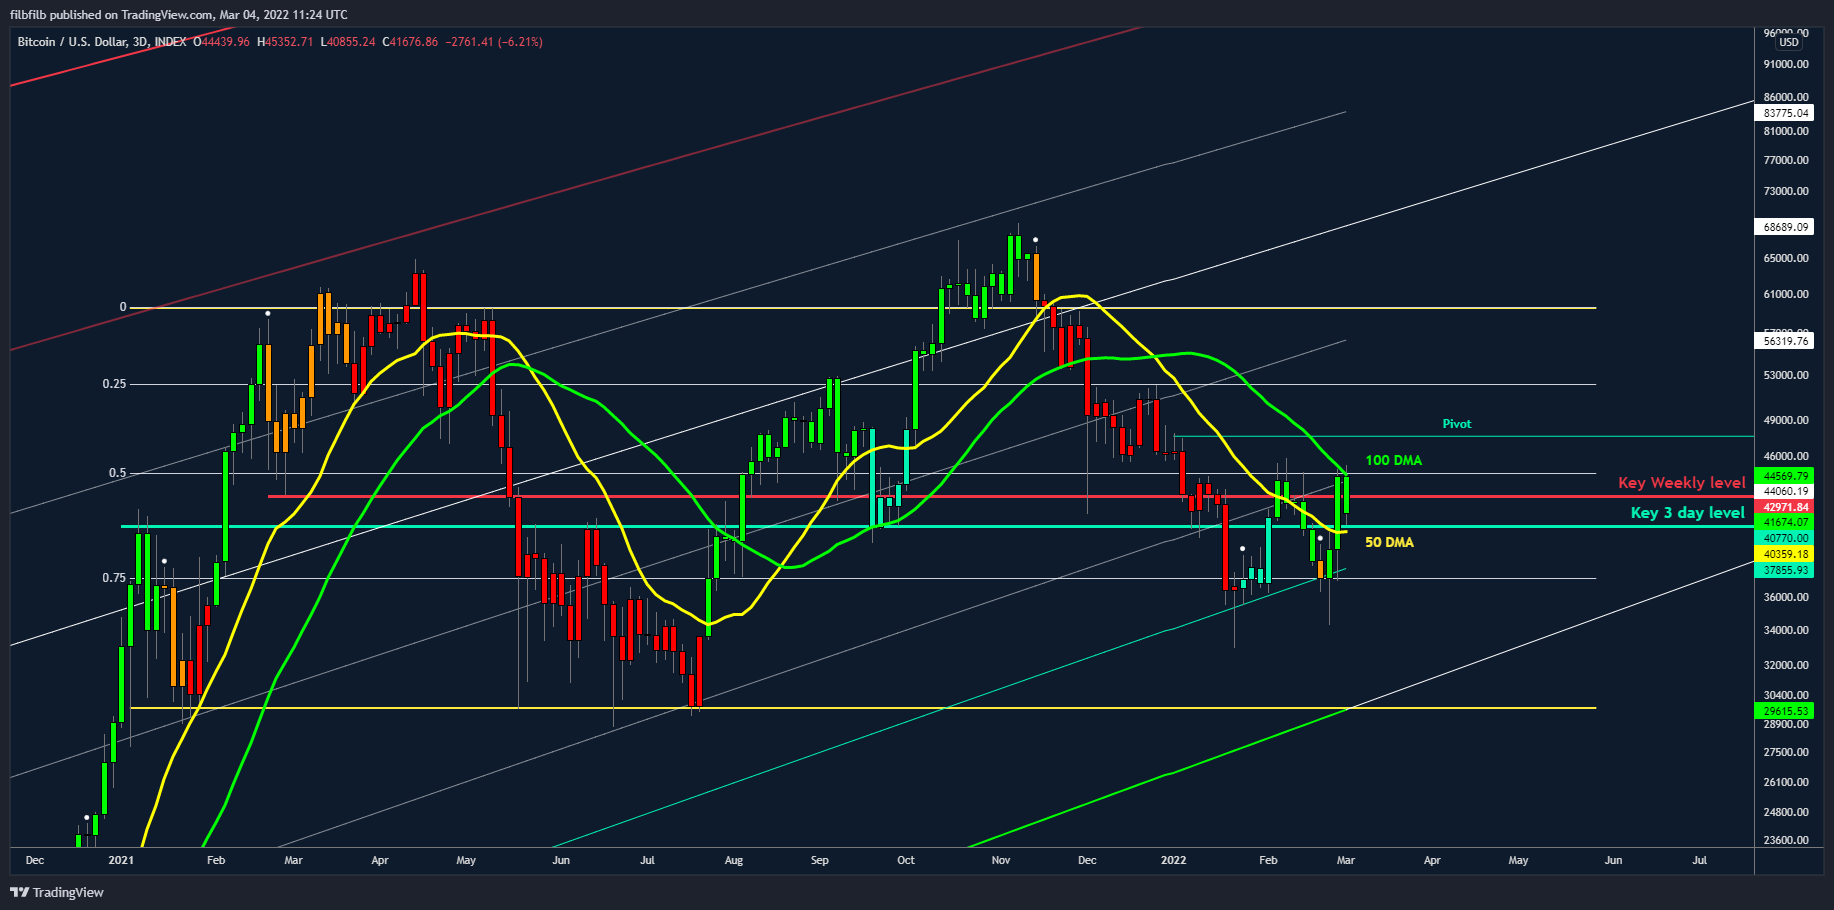
Figure 2. Bitcoin 3 Day Chart with Predator
Pivotal pivots
In the year which followed the final year in the 4 year Bitcoin cycle, the yearly pivot acted as resistance and was never reclaimed until the new bull market began.
This level is currently $48k and like its namesake, will most likely prove to be pivotal looking forwards. A clear break above this level would break the 4-year cycle theory in our opinion and open the door to higher prices. Below it and we remain at risk of lower prices.
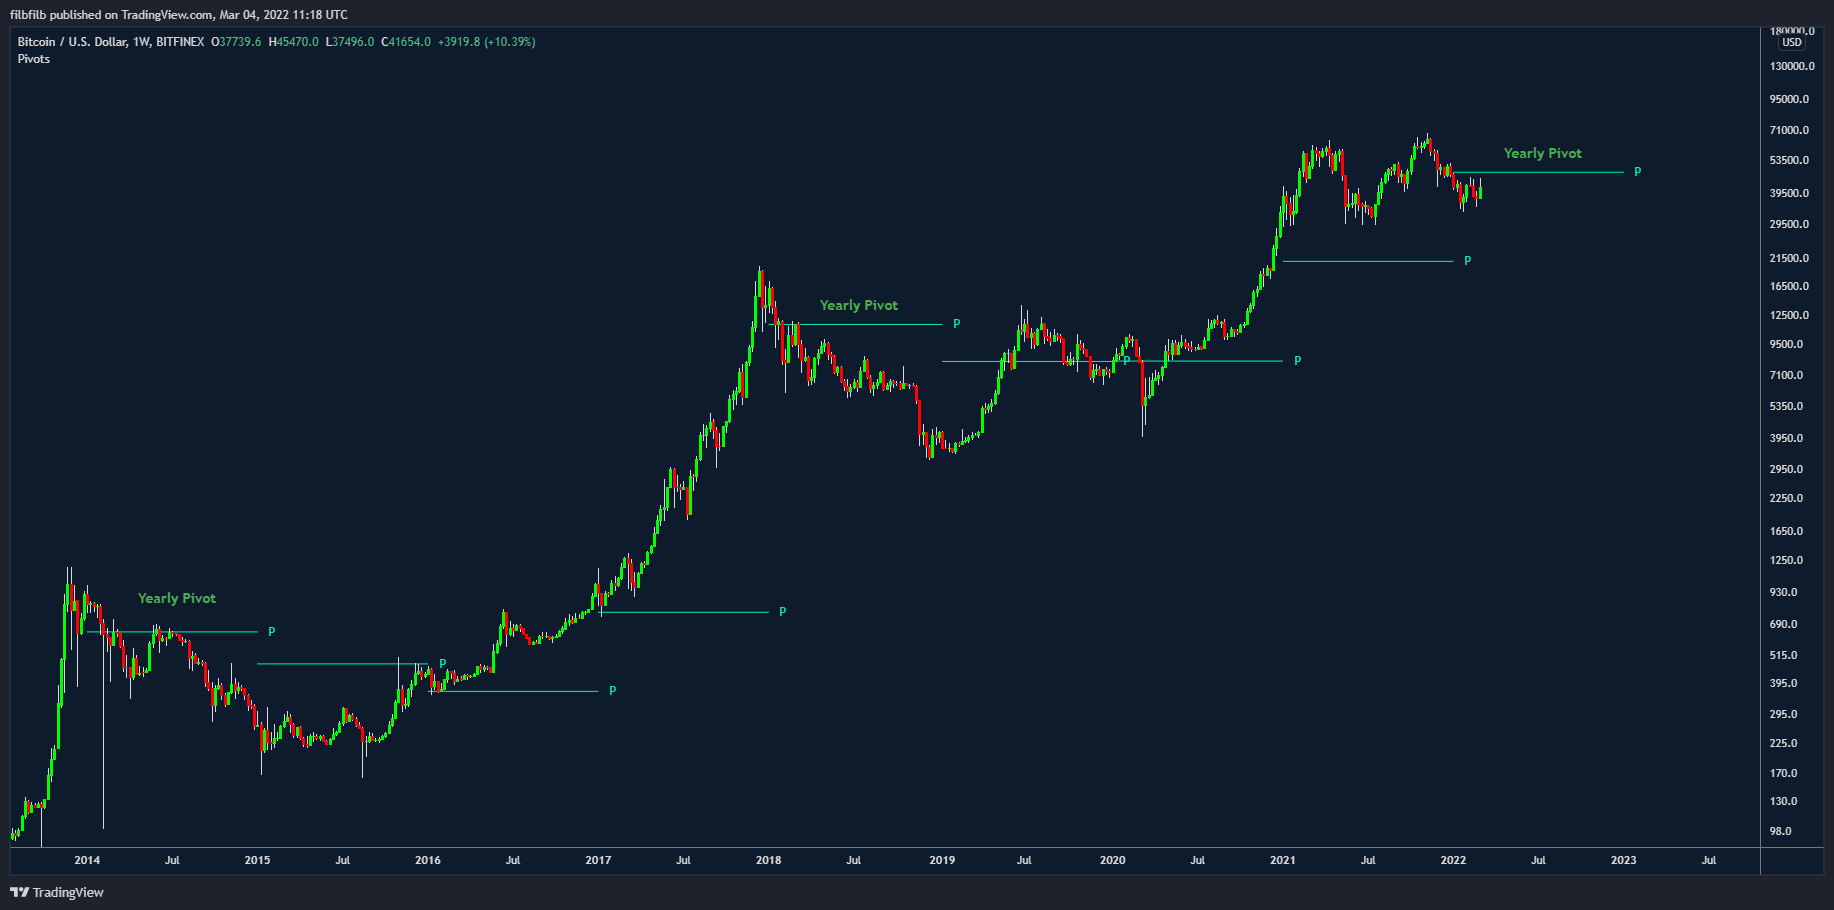
Figure 3. Bitcoin 4 Day Chart with Yearly Pivots
The yearly Pivot ($48k), like its namesake, has proven pivotal in the previous two bear markets. This level was never broken in the new year of the 4 year cycle. A clear break above this level would be very significant and implicit of a fundamental change. I will examine the extent to which this is on the table in the LTF analysis.
Bitcoin’s Rising tide
Bitcoin did not reach the top of the logarithmic regression bands during the cycle, which we have seen previously. In essence, we did not see upside derivation like that of which we have seen previously. As a result, Bitcoin is actually a lot closer to the lows of the log trend ($29.8k) which has been a tried and tested support level for Bitcoin. Over time, a tapering of this channel should be expected with an upside showing diminishing returns and lower volatility to the downside.
The good news is that Bitcoin has less far to fall because it did not run up quite as hard. The confluence with this now sitting at the bottom of the weekly range is significant in our opinion and supports the idea that we will not see such a drawdown as in previous cycles.
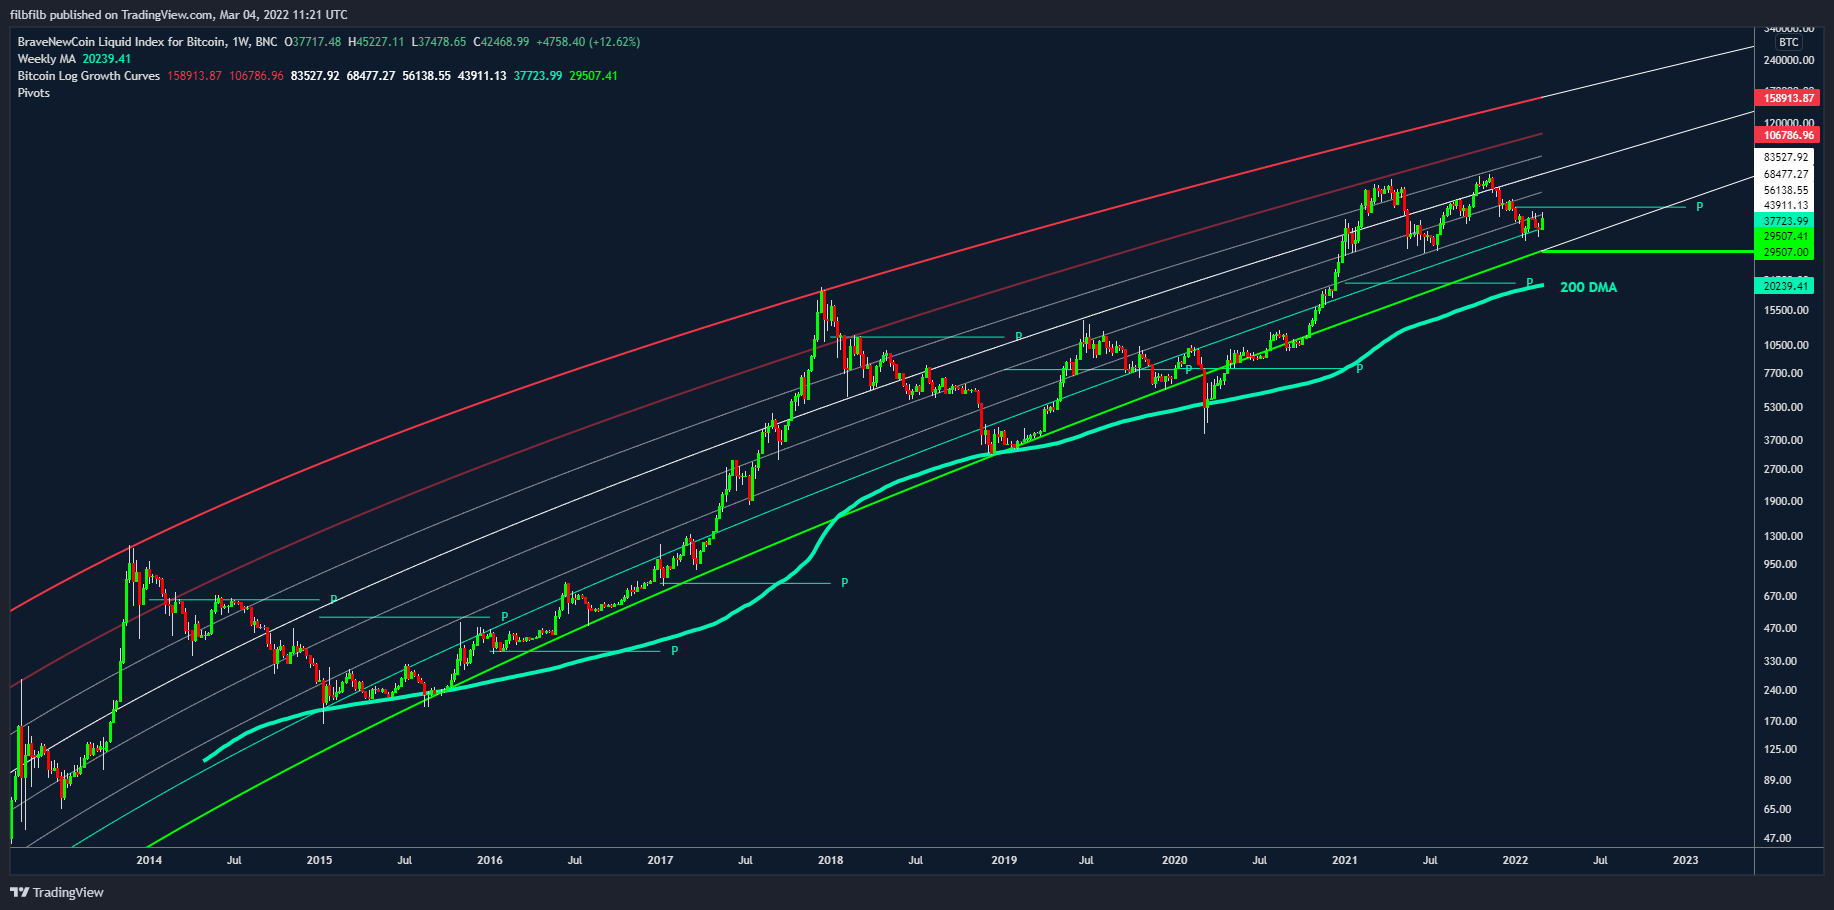
Figure 4. Bitcoin 3 Day Chart with Yearly Pivots & Log Growth Curve
The 200 WMA is now sat at 20k and has previously been the catch-all level when there has been capitulation events. This is now at $20k and rising and will continue to do so along with the log trend, hence the ‘rising tide’ analogy.
We see two scenarios – the tide rises with the 200 WMA catching up with the bottom of the log trend and we squeeze up and break the yearly pivot, or there is a capitulation at the HTF lows and we briefly dip towards the 200 WMA. A trigger that broke the log trend and did this the only time we have seen it was with COVID, a similar issue at hand is the Russia – Ukraine war, so there is heightened downside possibilities in play depending on how things play out, additional inherent systematic risk is currently high.
Low Timeframe analysis
Firstly let’s take a look at the swift move higher on Monday and some of the speculation about Bitcoin being used to circumvent sanctions.
It’s important to remember that ‘Oligarchs’ and people who are going to really move the market will have known about risks relating to the conflict for months. A mad rush to Bitcoin by these individuals now in response would be poor planning by them and therefore unlikely and these are the people who are likely to move the market.
In my view, this was a convenient narrative to push the market higher and generate liquidity; the market was already net short as shown by the LS ratio, with negative funding and alot of 10x short liquidity above. This is visible using the Decentrader liquidity tool where that liquidity was taken out all the way up the 100 DMA.
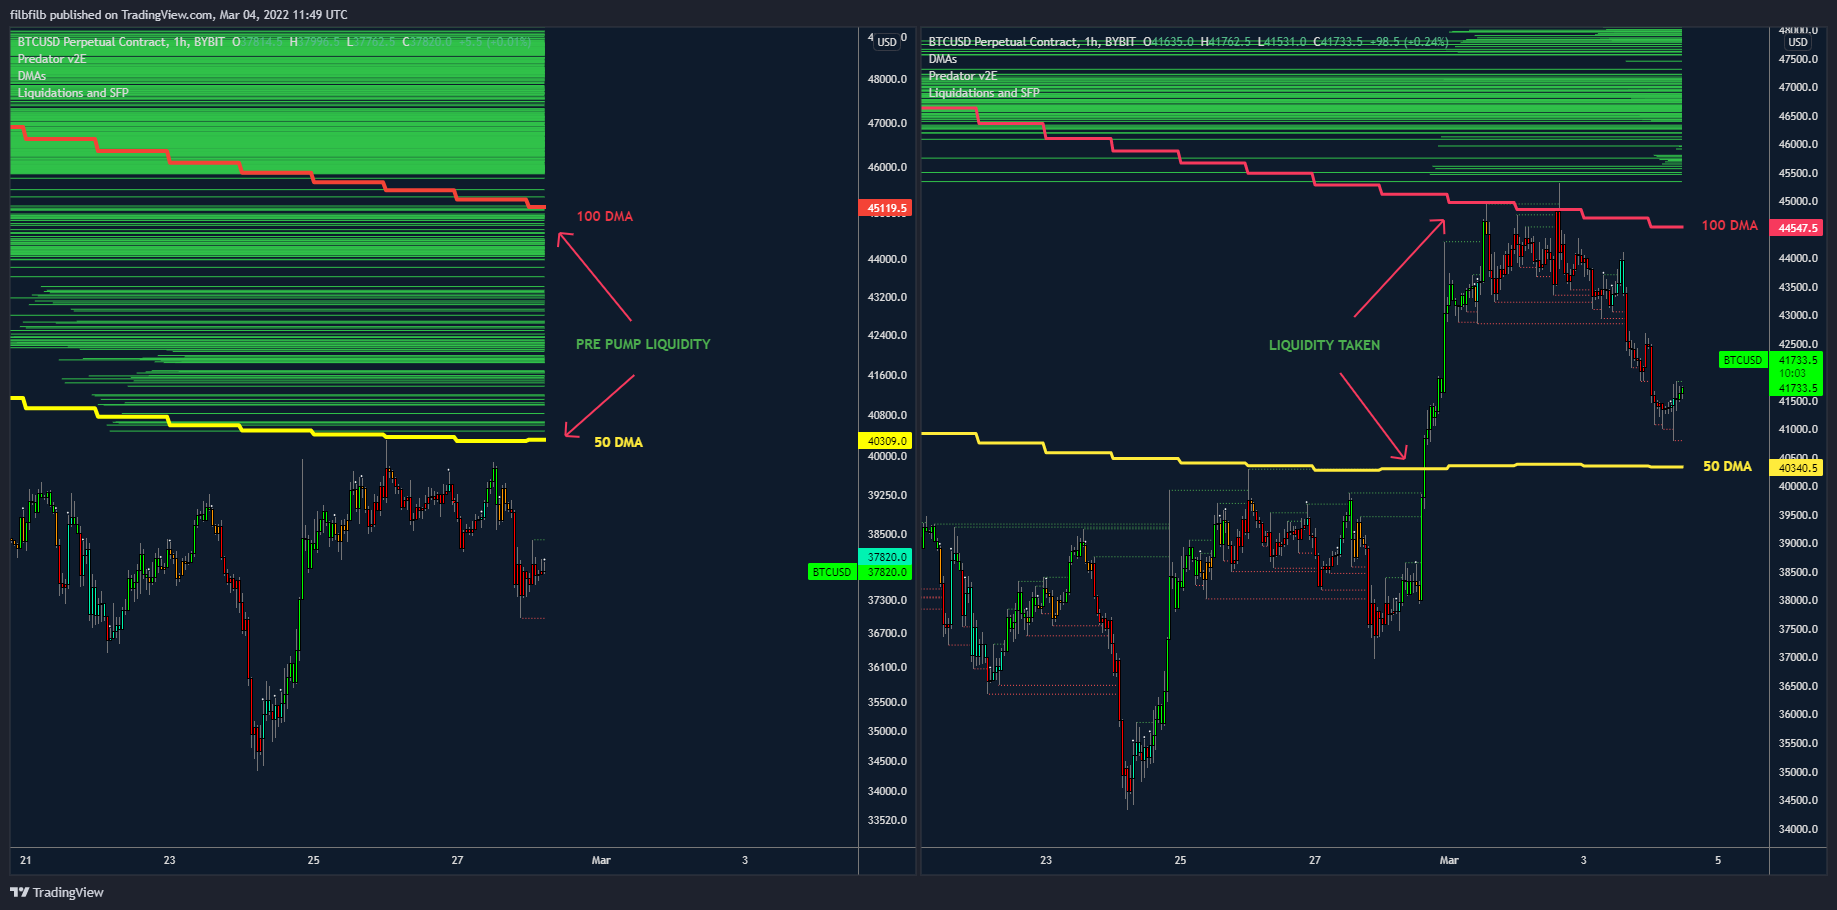
Figure 5. Bitcoin 1 Hour Chart with Predator and DT Liquidity tool
This enabled the market to move higher to resistance, where larger-sized spot sellers began selling again, therefore I am somewhat skeptical about the move up until we see key weekly closes.
The move fills up the order book and brings buyers for the bears to sell to; the below chart shows funding rising alongside the LS ratio. We have seen this continually on the way down and is something to be mindful of when looking for longs.
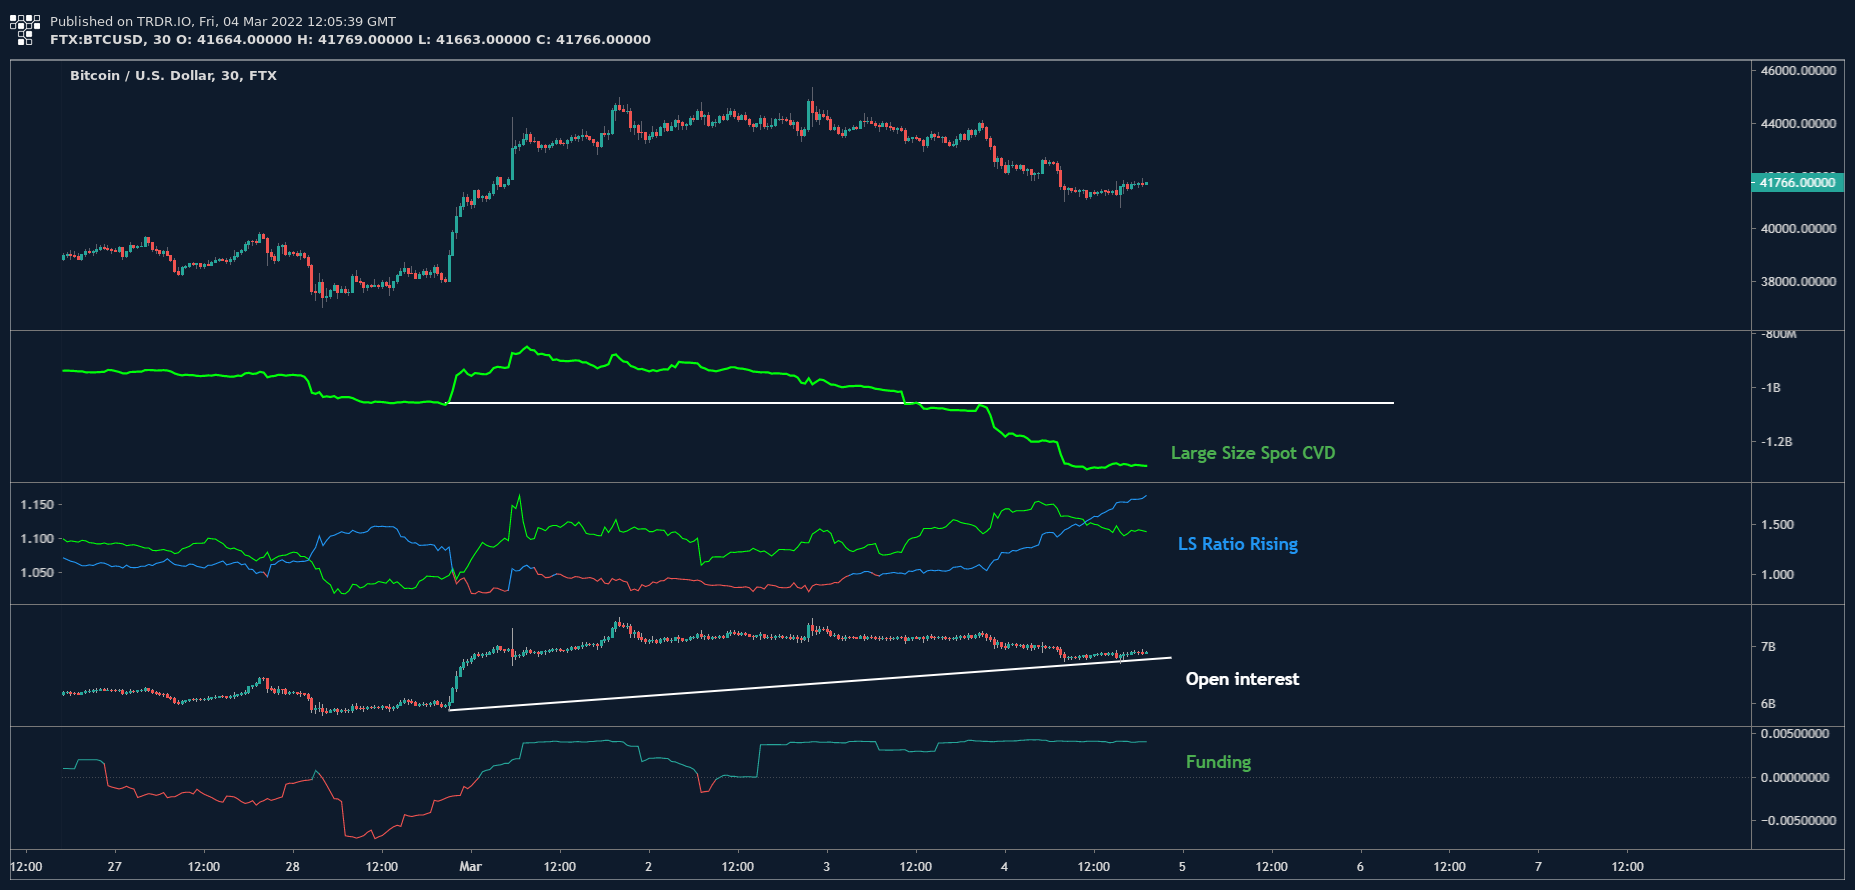
Figure 6. Bitcoin 30 min Chart range with CVD, LS Ratio, OI, and Funding
The 1-hour chart shows Bitcoin completing a repeating pattern. We now sit within the key range of the 3 day and weekly levels and is likely to form the battleground going into the weekly close.
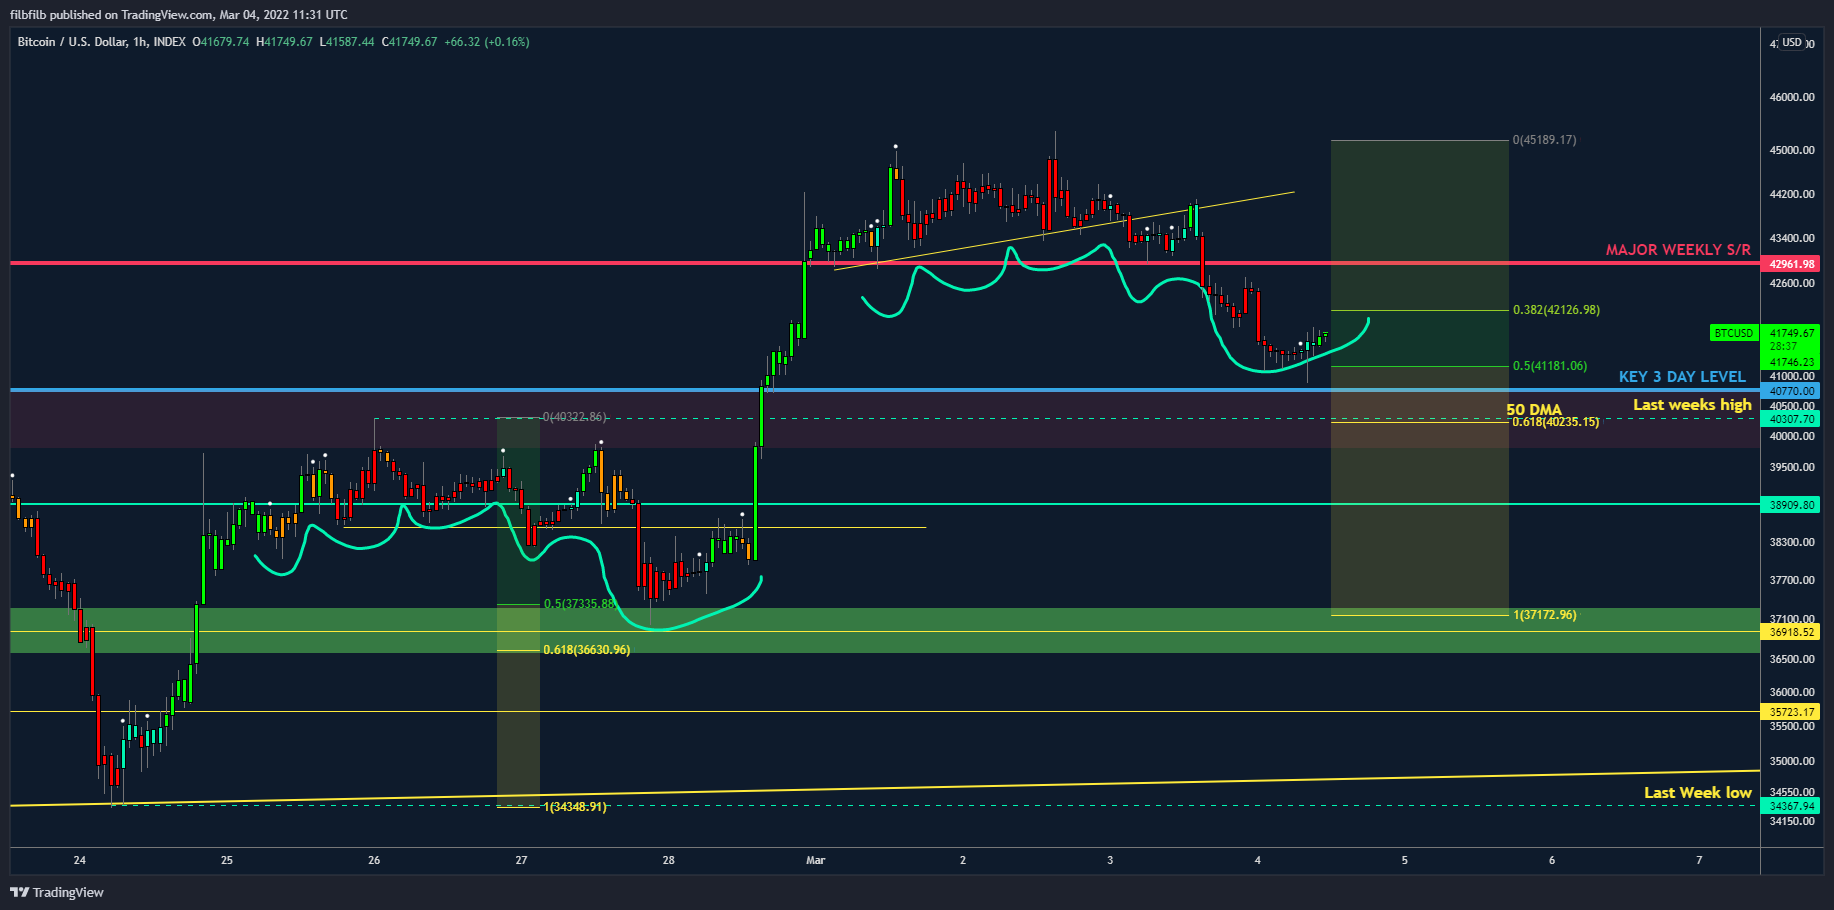
Figure 7. Bitcoin 1 Hour Chart with Predator
Scenario Planning
I will assess a few scenarios moving forwards, starting with the bullish one which is always a crowd-pleaser.
If Bitcoin can break the 100 DMA, we have a W bottom with liquidity above. A clean break of the 100 DMA and a tap into the liquidity above $46k, would imply a fast move through the stops towards $49k where there is a gap ahead of the psychological resistance of the $50k level where we would expect a decent-sized pullback before looking towards the fib extension target at $53k. There is also of liquidity fuel above $51k and it would mean breaking the yearly pivot, so a move up towards the $57-58k level would make sense.
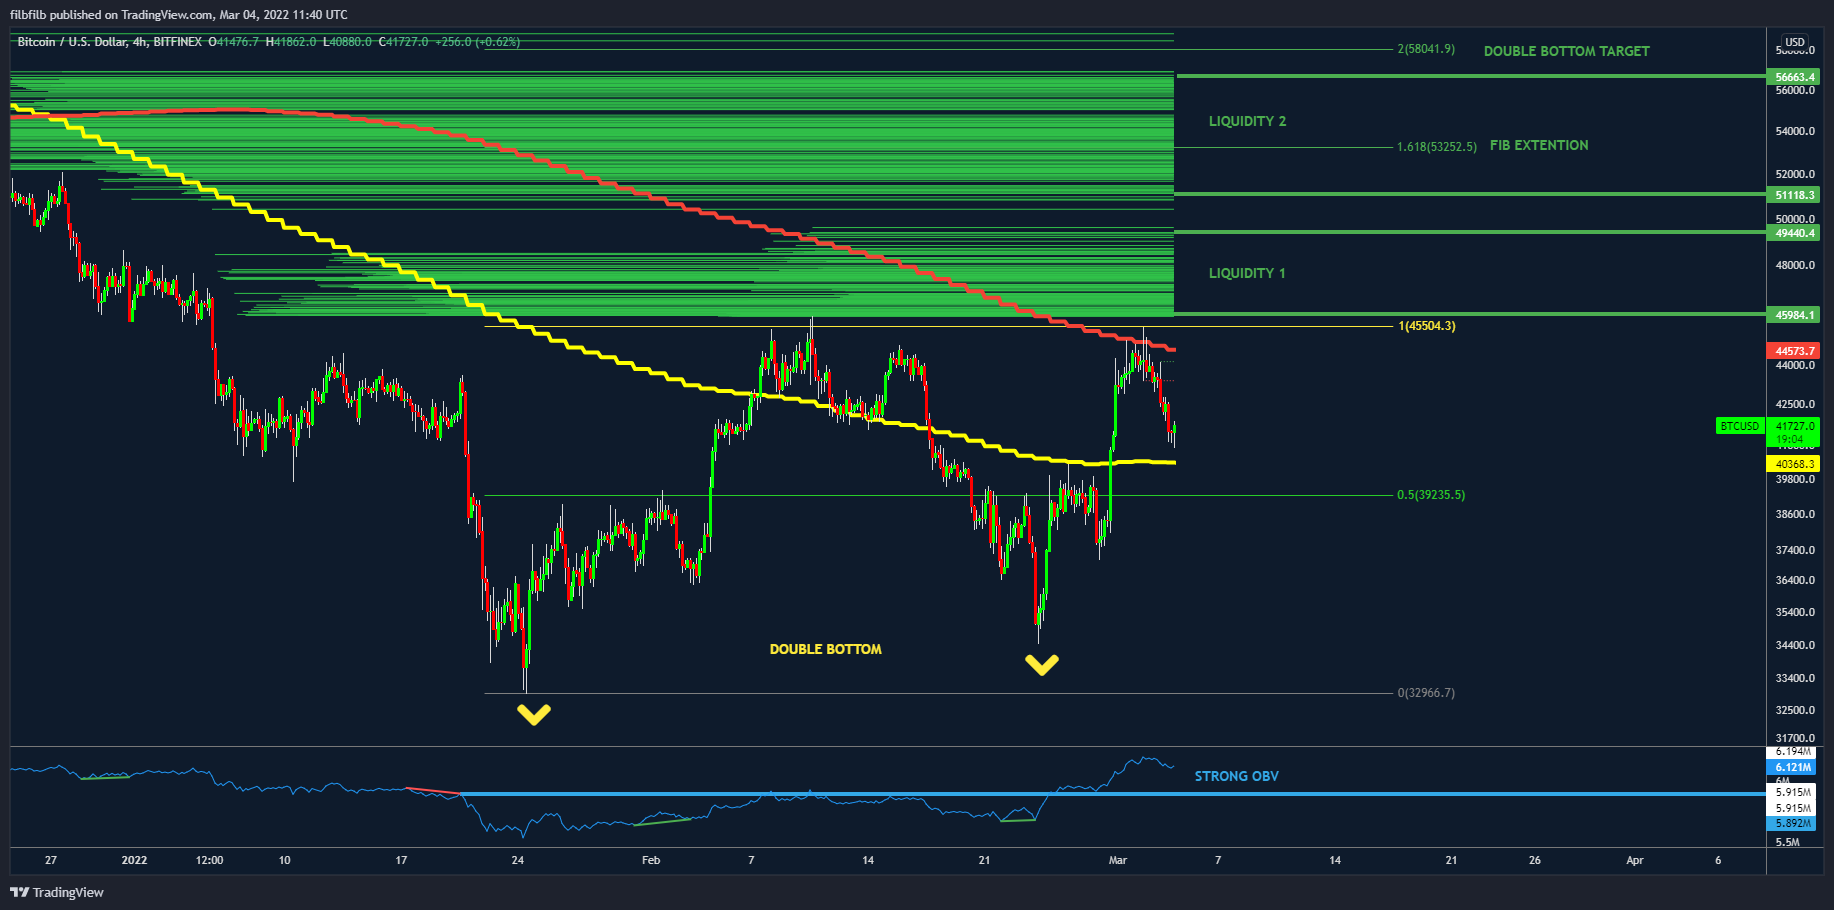
Figure 8. Bitcoin 4 Hour Chart
In the immediate term, if the 50 DMA and 3-day level can prove to be supported, a retest of the $43k and high timeframe level could occur. A retest and breakdown will provide a short opportunity back to the 50 DMA, a clear break and the bullish scenario above is on the table.
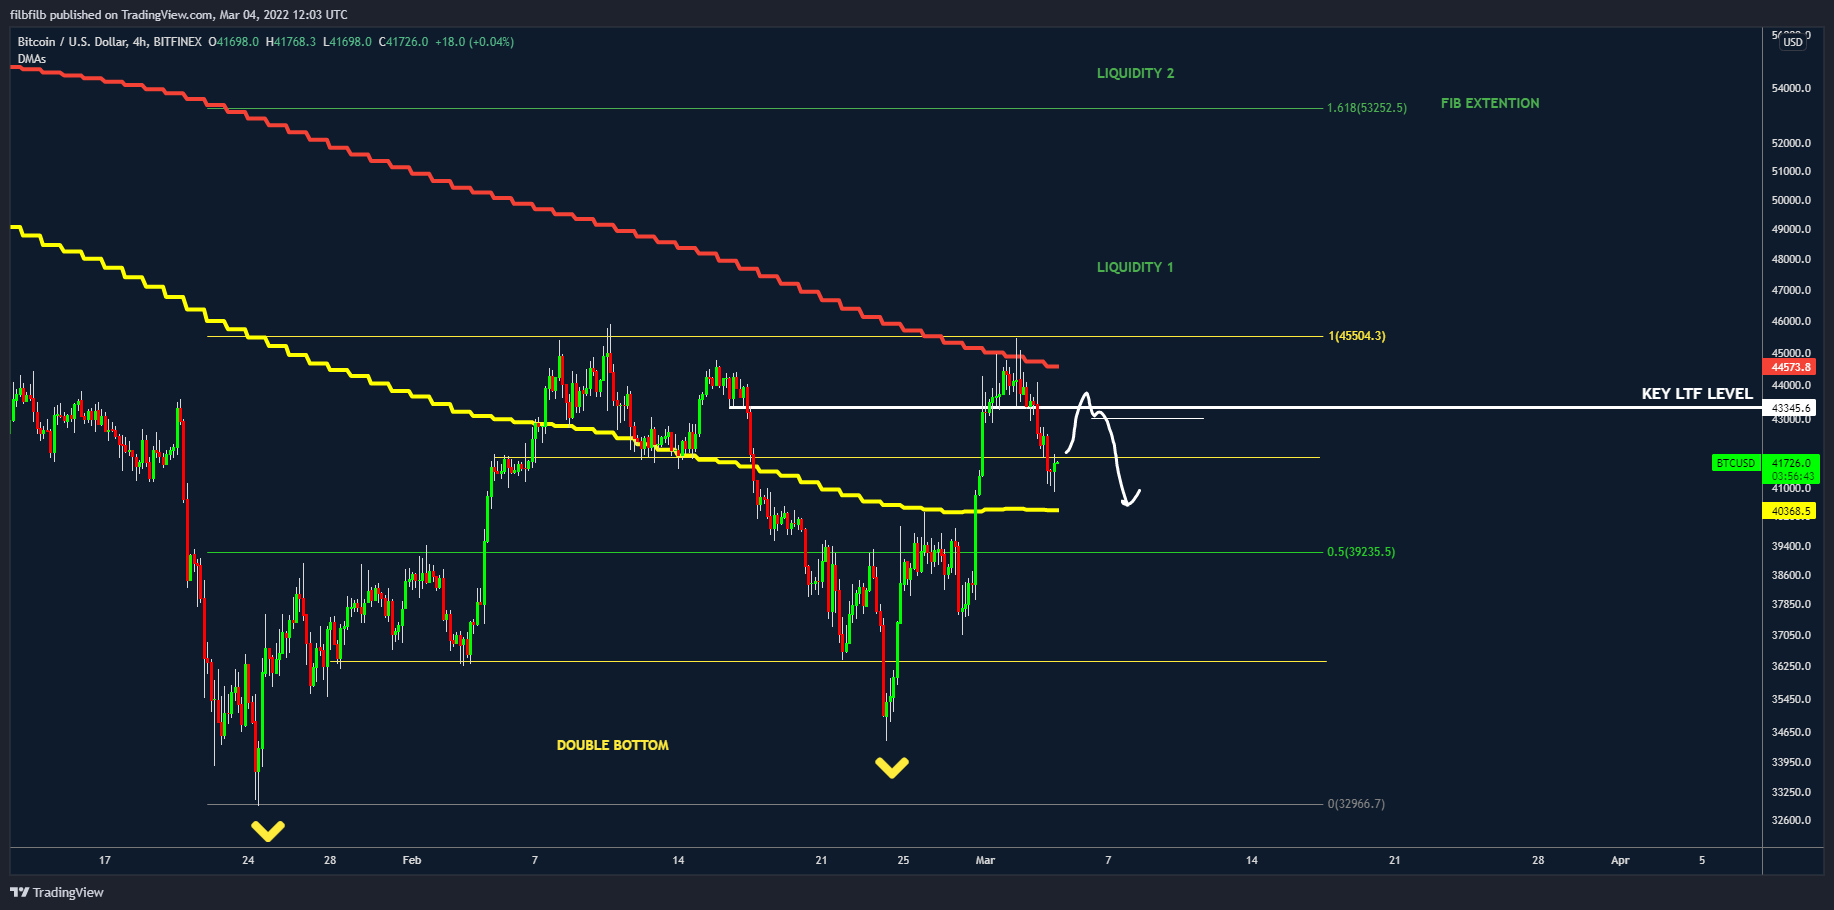
Figure 9. Bitcoin 4 Hour Chart
If Bitcoin fails to hold the 50 Day level, we may see something similar to the last time the 50 DMA was lost; a drop into the W range. A rejection of the $39.5k level there would open the door for a short trade to $36.5k.
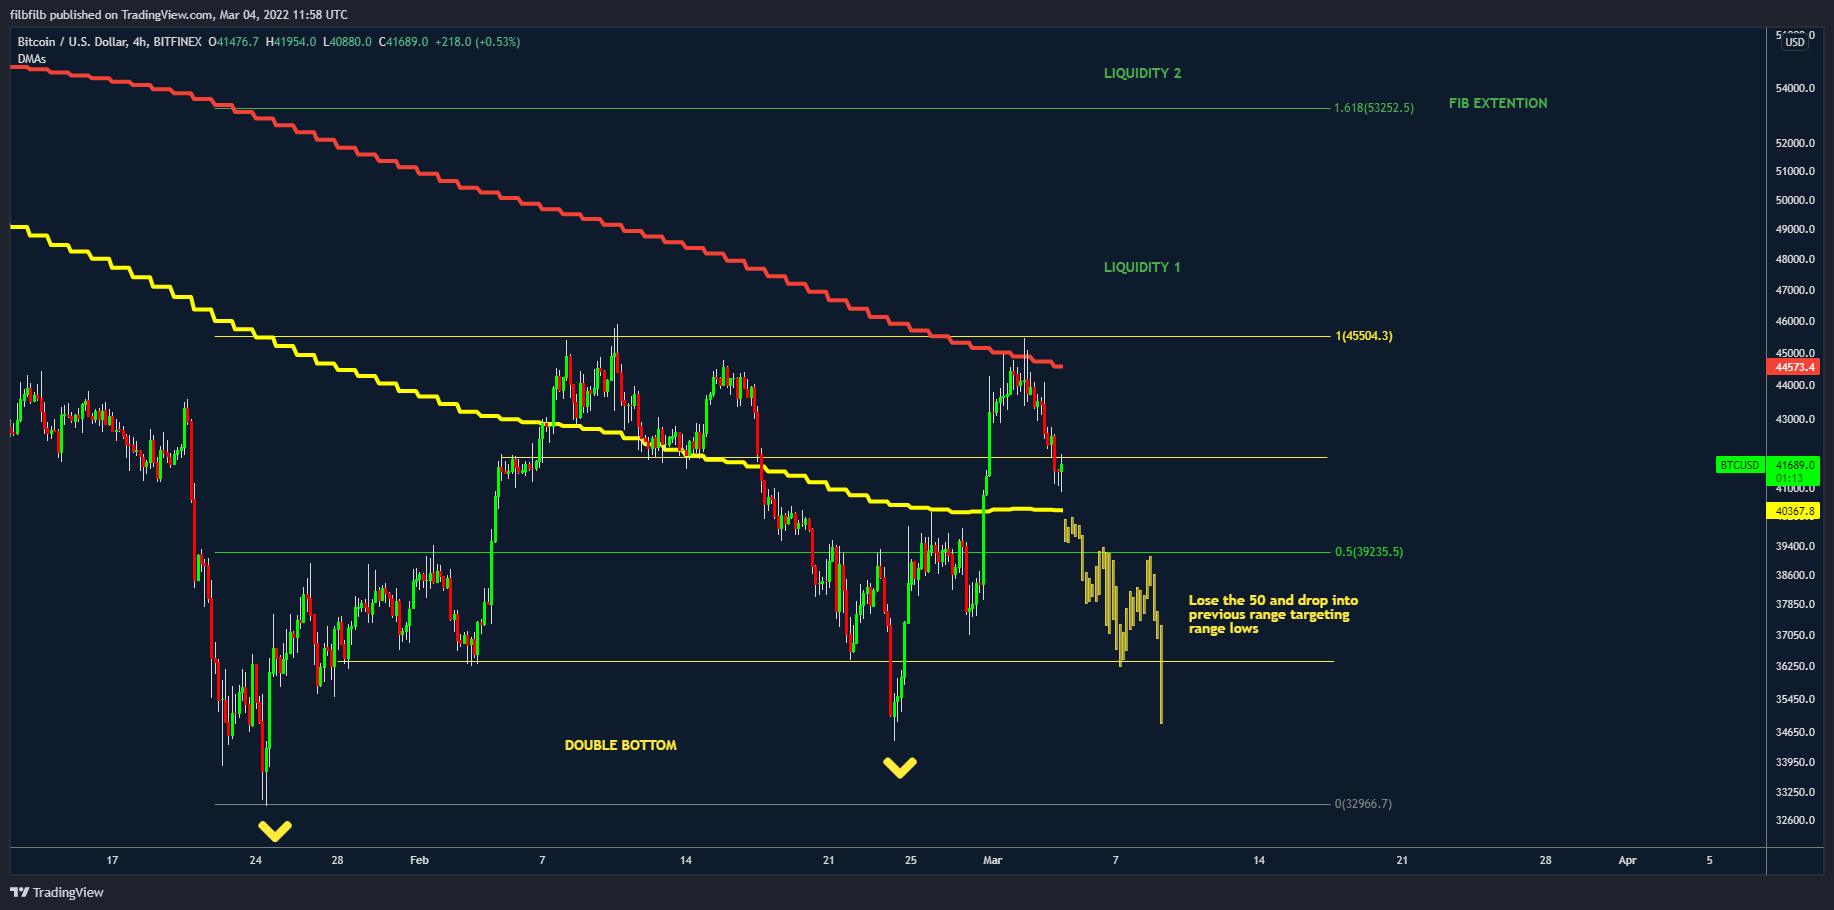
Figure 10. Bitcoin 4 Hour Chart
In order to manage the 3 scenarios immediately described, we will look to harness the use of Predator thermal, which is a heat map giving a cross-market, cross timeframe view of the market and comes free for Predator users.
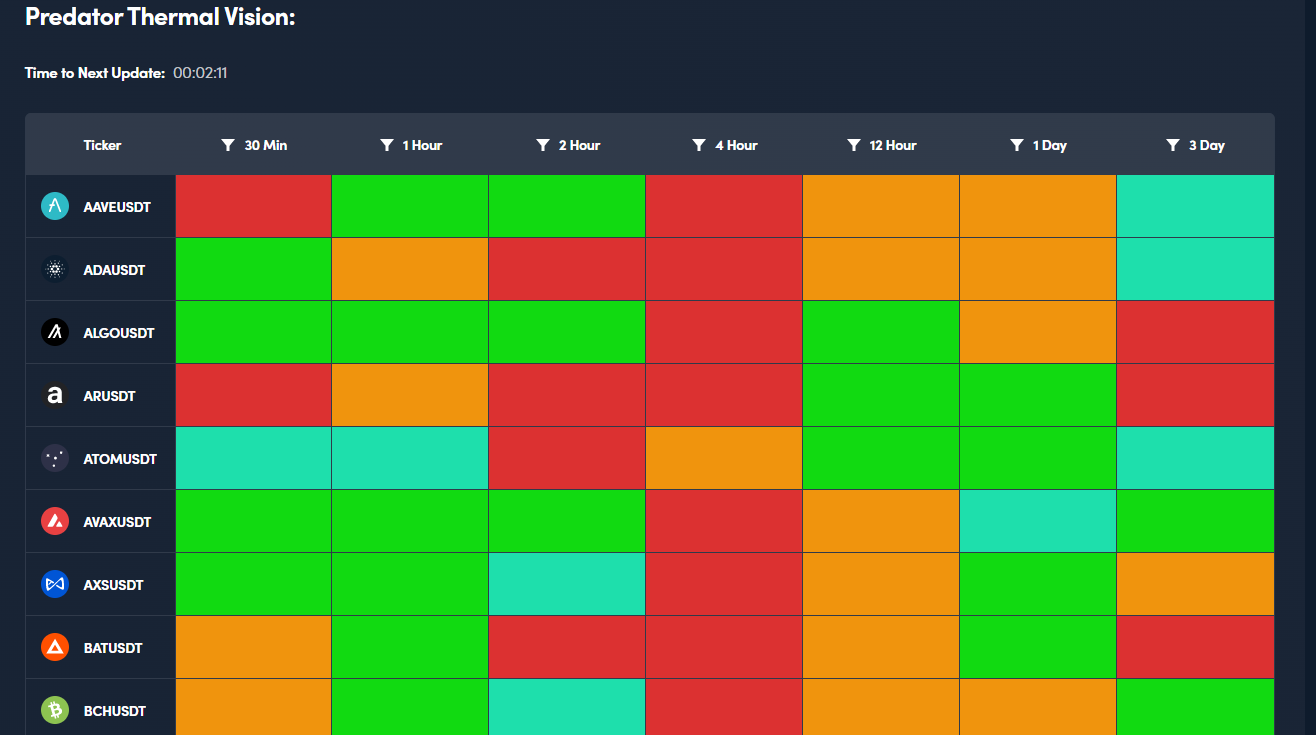
You can purchase Predator indicator HERE with 15% Discount until next week Friday to also get access to the NEW Predator Thermal Vision Tool and the Decentrader Toolkit.
Also looking for an edge, we will be using the Decentrader commando scanner which looks across the market giving an algorithmic-based scoring as to what is looking as strong opportunities (see more here).
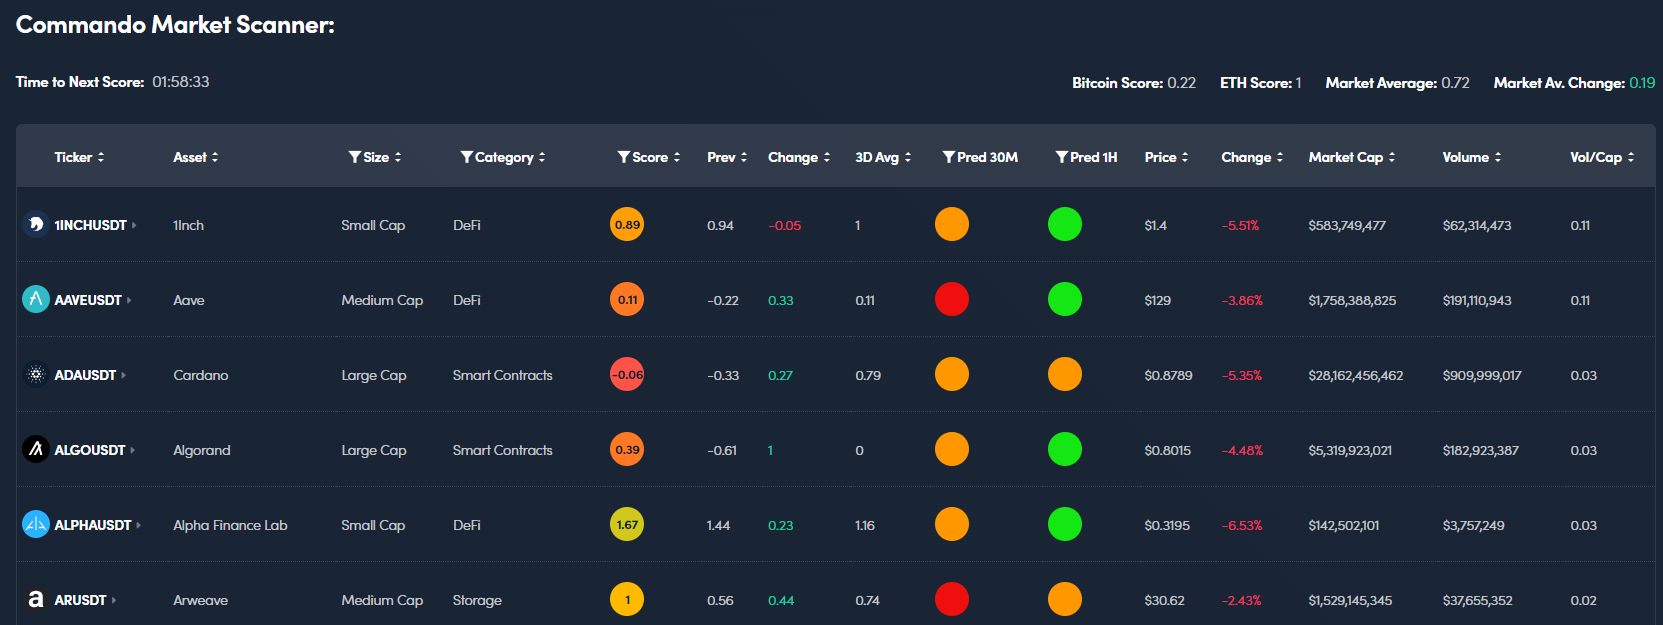
As an example, when Bitcoin crossed a 2.0 score, the price took a trip to $45k in the next 24-48 hours, before turning down.

Summary
So to summarise, Bitcoin is rangebound on a macro level, with a rising tide of support, but is yet to close the weekly above key levels described. Systematic risk in the market is high and as a result, volatility should be expected and trade size and duration should be considered with this in mind. Our strategy is therefore to play short-term trades using the tools at our disposal as described above.
Stay Safe.
filbfilb.
Disclaimer: Nothing within this article should be misconstrued as financial advice. The financial techniques described herein are for educational purposes only. Any financial positions you take on the market are at your own risk and own reward. If you need financial advice or further advice in general, it is recommended that you identify a relevantly qualified individual in your Jurisdiction who can advise you accordingly.


