Bitcoin Market Update – All-time Highs…Now what? – Predator Giveaway INSIDE!
Firstly; Congrats to all holders who navigated the pullback over the last few months!
After running from the 1st of October, without any sort of meaningful pullback before breaking all-time highs, Bitcoin is now consolidating around all-time highs a little over 20 days later.
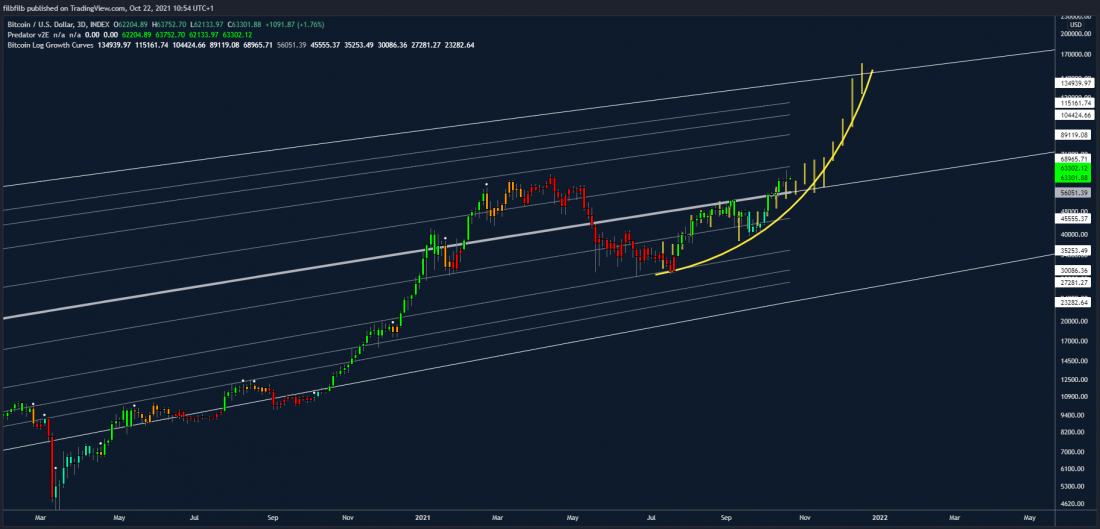
Our overall view is that Bitcoin is likely to progress higher through Q4 2021, as per our forecast towards $100k, particularly now that there is positive news around two Bitcoin (futures) ETFs now trading namely the ProShares Bitcoin Strategy ETF (ticker BITO) and The Valkyrie Bitcoin Strategy fund.
While we have 3 day Green Predator and remain above the 50 DMA, we remain bullish overall. There are zero instances of Bitcoin breaking significant previous all-time highs and failing to continue higher.
https://www.tradingview.com/x/lMP8Ijzq/
3 Day BTCUSD Chart with Predator indicator overlay
Did you know? You can now trial the Predator Indicator for 4 months for $400. Click to get it now!
More ETF decisions are on the way.
There are a number of further Bitcoin ETF responses expected in the coming months as we shared on Twitter
SEC first response on futures-based ETFs (Teal)
Final decisions on Spot-based ones (Yellow) pic.twitter.com/1lZFYxeS46— filbfilb (@filbfilb) October 13, 2021
An Exchange-traded fund opens the door of demand to more market participants, who were previously constrained from entering the market. Looking at the gold SPDR Gold shares on November 28th, 2004, Gold pushed higher over the following years by >300%, a significant move for an asset that had already been established as a store of value for thousands of years.
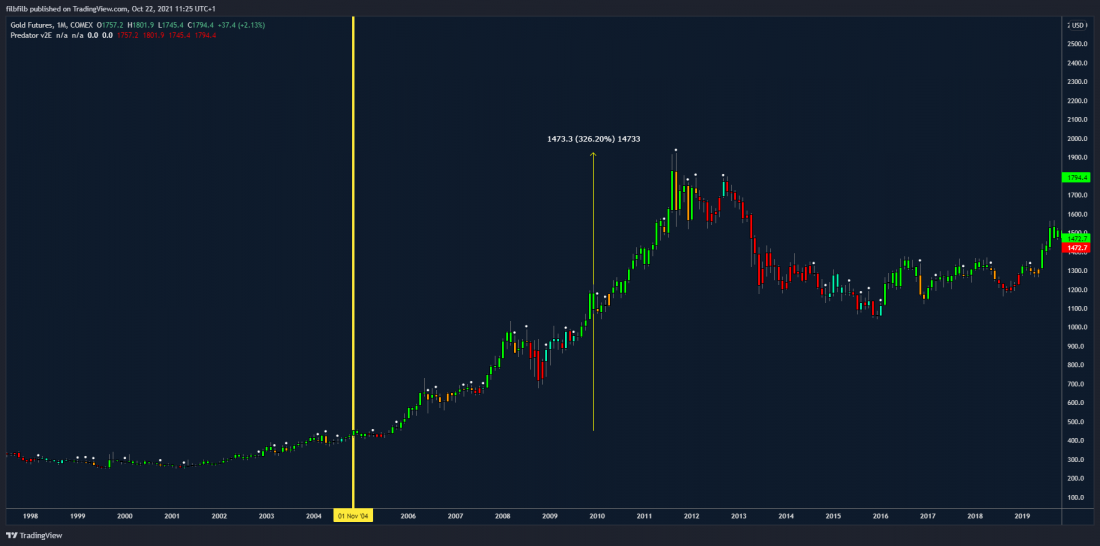
https://www.tradingview.com/x/VxdRsOhz/
1 Month Gold Chart with Predator indicator overlay
Did you know? You can now trial the Predator Indicator for 4 months for $400. Click to get it now
On-Chain analysis
1 Year+ Hodl wave
The below chart shows the percentage of coins held for greater than one year. This chart is particularly important as it shows that the holders at around 54% of coins – appear uninterested in selling in the range from which we are trying to leave.
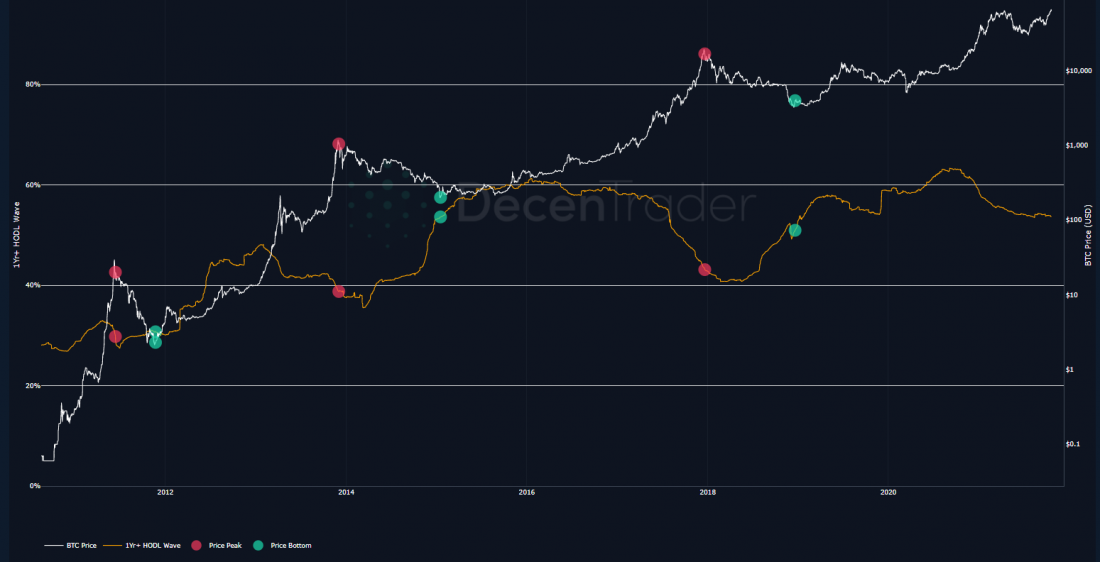
Decentrader – Bitcoin 1 Year Hodl Wave
Therefore, to unlock this supply, the price needs to go higher (or much lower than $30k) and as such remains as one of my more important fundamental charts from a market psychology POV.
Looking at previous cycles, price peaks appear to come once the percentage of the coins held for 1 year or more additional coins have dropped to the low 40%.
The reason why this is important is that coins will have passed from cyclical strong hands to end-of-cycle speculators who are generally easy to spook out of the market, as we saw with the inflow of new participants earlier in the year.
On-exchange coins
Coins on the exchanges have typically implied more risk of selling. At the time of writing, this is clearly in a downtrend, with supply being moved off-exchange into cold storage as can be seen by the green line below.
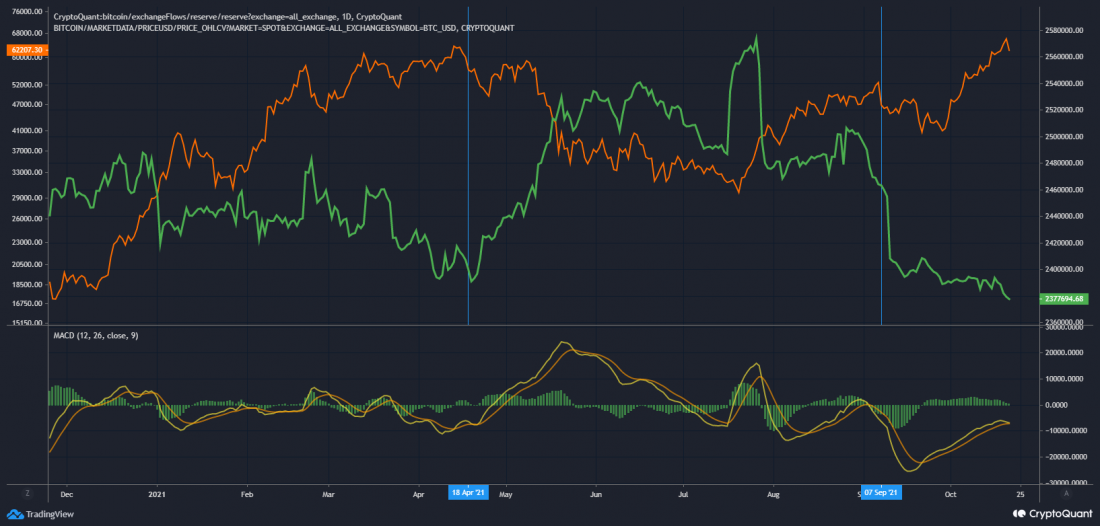
Bitcoin Price (Orange) vs Exchange Held Supply (Green) Source; CryptoQuant
Should this situation change, coupled with a down move as we saw in May, this would be a red flag, however, under the current circumstances, it suggests a divergence between increased demand and available liquid supply, which is bullish.
Price action
Bitcoin Fractal
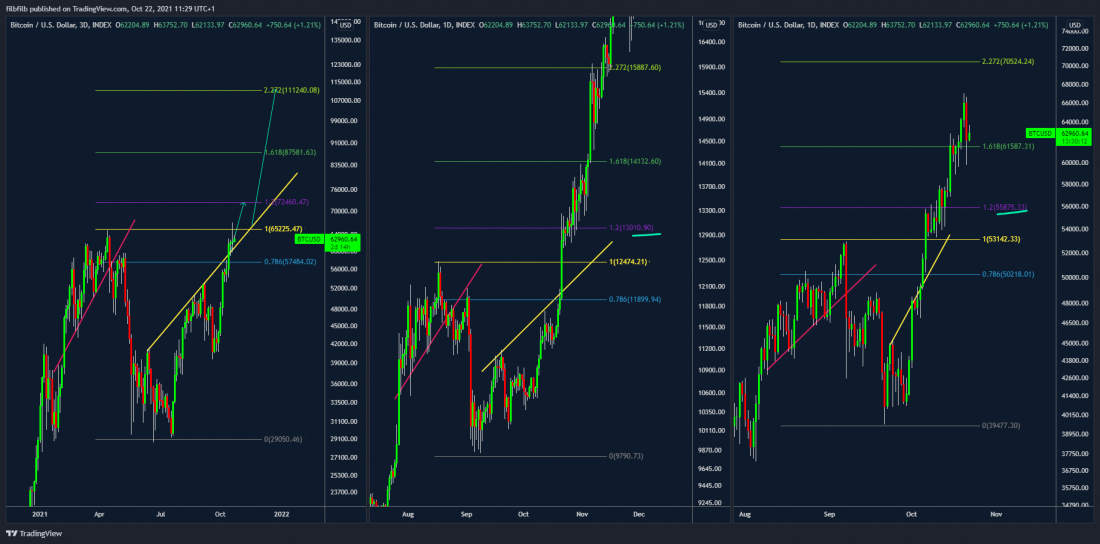
We have been tracking a Bitcoin fractal pattern for a number of weeks now, which, if it continues, would imply to play out, that the next major stop higher for Bitcoin would be $72k if momentum can be maintained, after which the 1.618 extensions suggests around $88k would prove to be a target of interest, which ties in with the idea that $100k will see some front running by sellers.
https://www.tradingview.com/x/fcESSUfL/
Multi Time frame BTCUSD fractal
Price action heading into the weekend
Funding and open interest
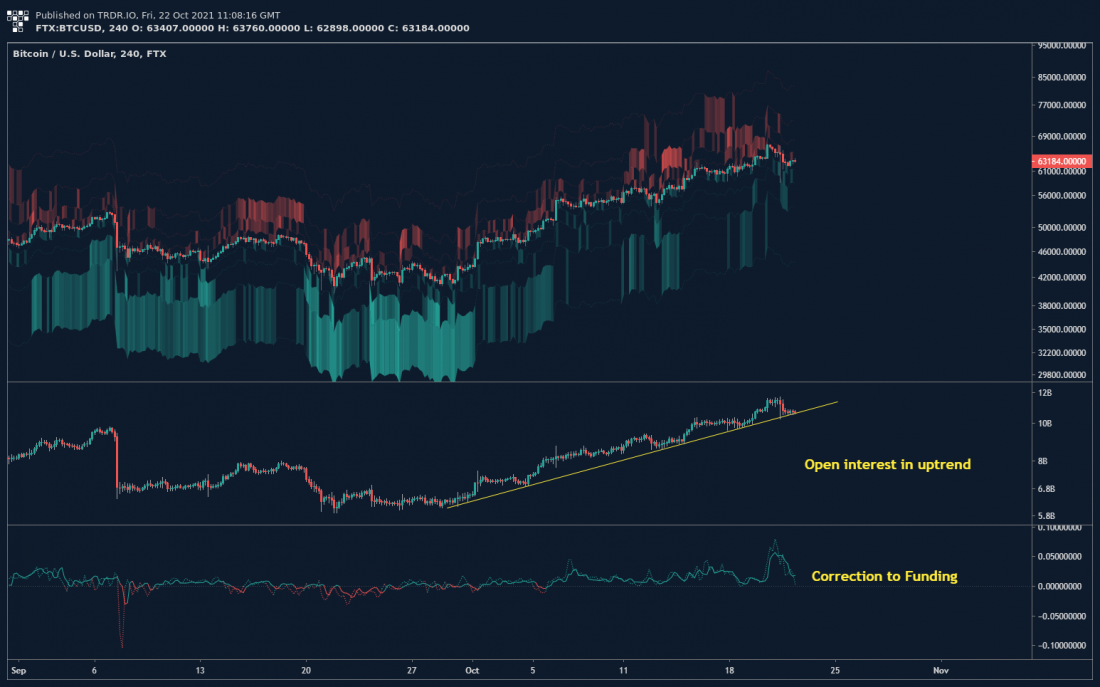
Derivatives funding has reset towards more balanced levels following the correction on the 21st of March and Open interest has remained in line with the uptrend.
https://trdr.io/snapshot/D4852BD340907D3B.png
BTCUSD 4 Hour chart with TRDR – Get Access TRDR Here
While this remains to be the case, the risk of correcting lower is reduced. However, we will be looking out for increased funding coupled with open interest increasing, which typically means bulls are fighting against new short interest. Conversely, rising prices coupled with an increase in OI and decrease in funding will be implicit of higher prices.
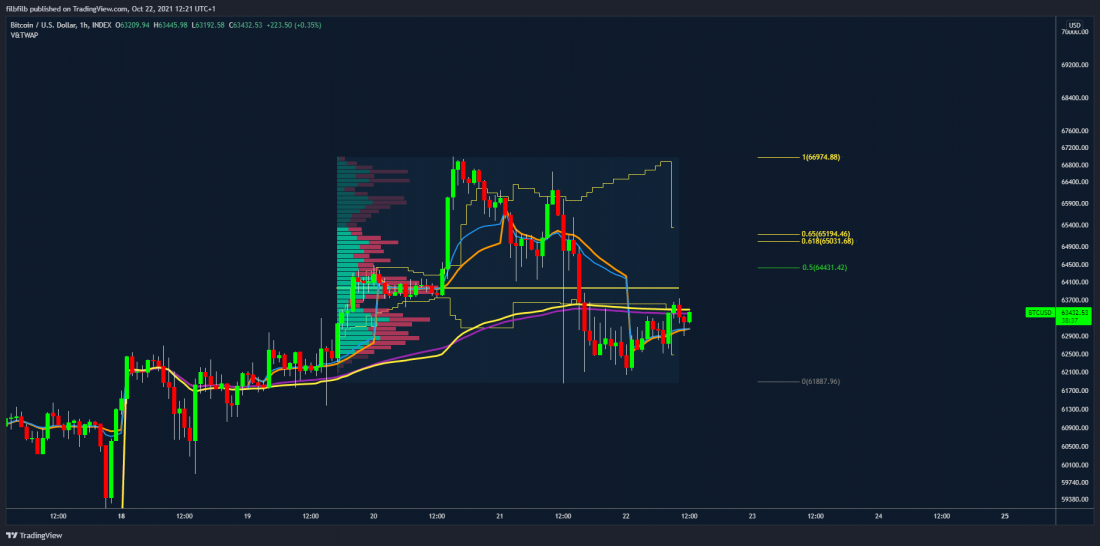
A weekend push higher is likely to be met with initial resistance at $65k, which is the 61.8% retracement from $66800 and the VAH of the range. While prices remain above the progressing intraday VWAP, this is the immediate short-term bullish objective.
https://www.tradingview.com/x/BQhqYm2y/
BTCUSD 1 Hour chart
Bearish Case
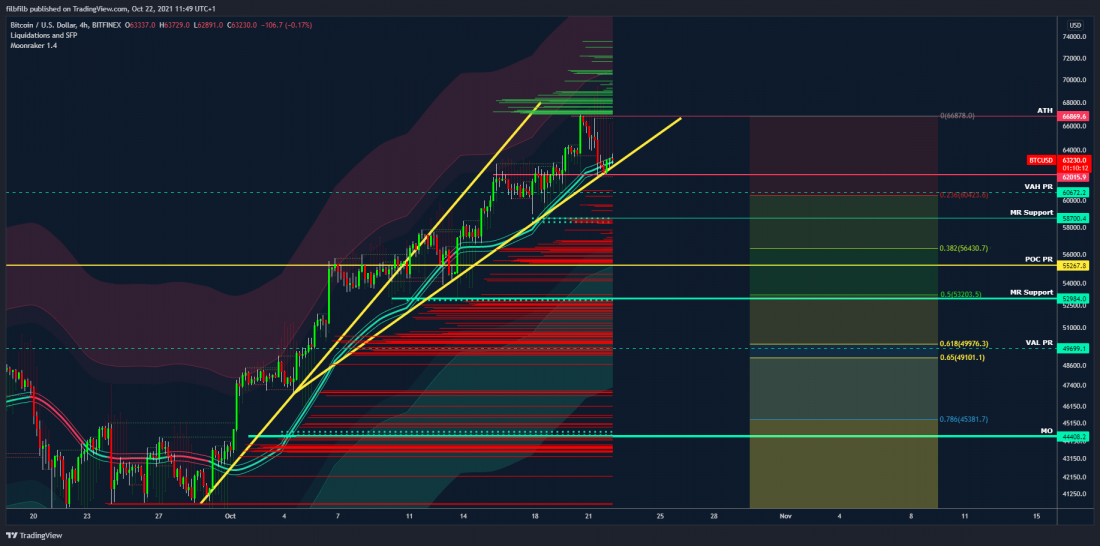
The below chart shows that Bitcoin is currently hugging a trendline above the VAH of the previous ATH range, along with the Moonraker mean reversion support.
A break of this trend would be considered bearish short-term and would see the potential for a bearish C-Fork pattern to play out.
Weekends around all-time highs have previously been particularly volatile, often seeing bid filling exercises completed while the market is less liquid; so even if Bitcoin is bullish overall, its still possible that a weekend correction could play out.
https://www.tradingview.com/x/BOkMALpn/
BTCUSD 12 Hour chart with Decentrader Liquidity and Funding Indicator & Moonraker MR strategy
Note: Liquidity indicator available as part of the Predator package, or The Decentrader Toolkit
The above chart also shows areas of probable liquidity which also generally lie in between the key fib levels, which implies that support at 59k, 55k, and 53k, with there being a lot of liquidity in between the 50 and 61.8 retracement levels. Therefore, if there is a significant reversal and break in structure, $50k will be a significant area of interest to us.
Although there is no significant evidence of this now, we are prepared for an opportunity, should it present itself. Even if prices do retrace to these levels, it does not break our overall bullish thesis.
Concluding thoughts
Bitcoin has been stealing the show for some time, with the alt/BTC pairs struggling to keep up with the pace of Bitcoin, despite generally moving higher. As we saw when Bitcoin broke all-time highs above $20k, this may continue for some time, but we do expect there to be a catch-up by the end of the year.
The backdrop for Bitcoin, across all fundamentals, hasn’t looked better and as mentioned above, the expectation from us is for higher prices.
Price is at a critical pivot point at the time of writing – any corrections towards $50k we consider buying opportunities and price appreciation into low funding coupled with increasing Open Interest suggesting Bitcoin could be ready for another leg higher.
Giveaway
To celebrate Bitcoin ATH we giving away a Predator Yearly Account to a lucky winner. All you need to do is just to make sure that you subscribed to our newsletter and we will pick a winner next Friday. If you would like to subscribe to the newsletter you can do it HERE.
Good luck in the markets and happy trading! Like what you read? For the regular market analysis and live streams across all crypto assets with PositiveCrypto and FilbFilb, join us HERE from as little as $1 per day.
Disclaimer: Nothing within this article should be misconstrued as financial advice. The financial techniques described herein are for educational purposes only. Any financial positions you take on the market are at your own risk and own reward. If you need financial advice or further advice in general, it is recommended that you identify a relevantly qualified individual in your Jurisdiction who can advise you accordingly.

