Bitcoin – Ready To Rally After The Pullback
Bitcoin spent much of the past week retracing after a failed attempt to break above all-time-highs.
At the time of writing price is now attempting to rally after reaching solid support, and we believe there is a good probability that the rally will continue going into next week and beyond.
Context
A little over a week ago, on 20th Oct, price briefly accelerated up to $67,000, but then proceeded to pullback -14%. The primary reason for the pullback was due to token-margined leverage traders aggressively longing the final run up to the all time high and brief breakout levels.
As we have seen so many times in crypto when funding rates jumped up and price was testing previous all-time-highs, those late-longers got caught out and ultimately liquidated as the market retreated.
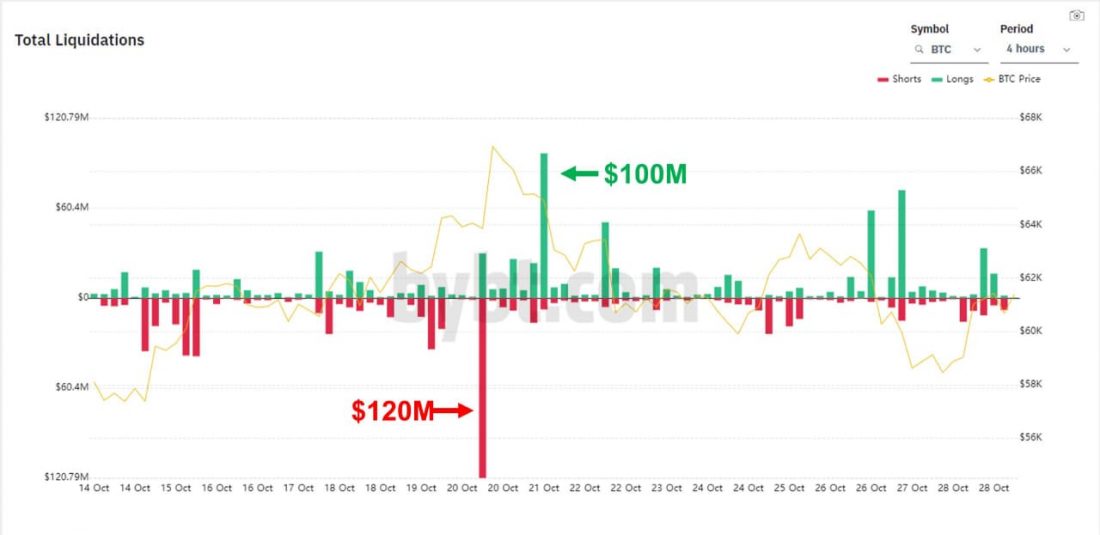
Fig 1: Bybt Total number of liquidations.
The punishment for many leveraged traders was felt on both sides as shorters were liquidated to the tune of $120M within a 4hr period on the 20 October, before over $100M of late-longs were liquidated the following day.
Since then, the price continued to retrace and has now pulled back to the failed rally point from May this year. Given that this level did not act as meaningful resistance during the run-up earlier this month (as is so often the case in crypto), it is not surprising that we now see it act as support following the failed breakout.
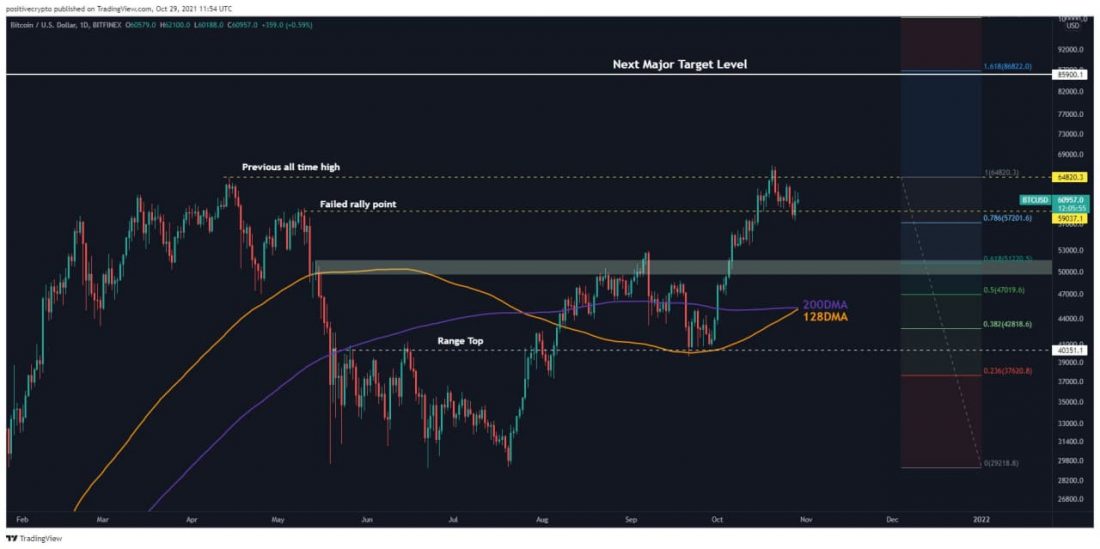
Fig 2: Price has retraced back to the failed rally point and near to the 0.786 Fibonacci level.
As a higher time frame signal of bullish trend continuation, we are about to see the 128DMA cross over above the 200DMA. In previous bull markets, the price has seen sustained rally’s after such crossovers. On a technical, market cycle, and on-chain basis, we continue to believe that the next major area of difficulty for $BTC will not hit until we approach $85,000 – $90,000.
Funding and SOPR reset
Encouraging signs were found in funding rates yesterday as they reset to neutral/negative levels. Importantly this was the case on token-margined funding rates as well as USDT margined.
In addition, when we examine signals on-chain, Spent Output Profit Ratio (SOPR) had also reset to neutral. This indicates that sellers were selling at break-even, which at this stage of the bull market is indicative of a healthy retrace. Within on-going demand in the market, sellers only sell for short periods at a loss before the market demand buys up the cheap coins and price continue to rally.
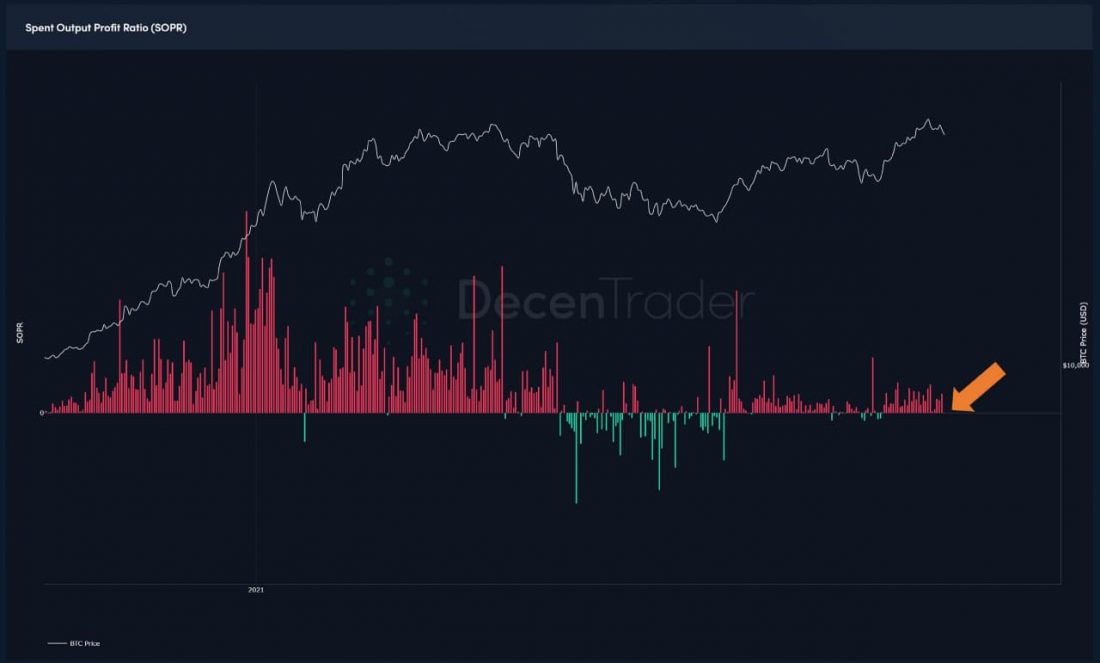
Fig 3: Spent Output Profit Ratio (SOPR) reset to neutral.
As we saw following the March 2020 Covid crash, after such large periods of sustained selling like we saw this summer (green on the chart), any subsequent negative SOPR prints or resets to neutral are likely to present healthy retraces aka potential spot-buying opportunities. We had one of those opportunities yesterday, highlighted by the orange arrow on the chart above.
THE ONLY PLACE TO VIEW SOPR LIVE DATA WITHOUT SIGN-UP OR FEES IS HERE.
Moonraker indicates potential rally opportunity
The Moonraker tool allows for multiple trade strategies. One strategy is to long a retest of the mean reversion line. Current price action is setting up for such a trade opportunity.
In such a scenario one potential take profit level is the red volatility band. Currently, that is sitting +14% above the mean reversion line where the trade would be entered should price retrace to it in the next couple of days.
An alternative strategy option will be to take profit once price rallies and then falls back to the mean reversion line following the rally…as we saw on 20 October.
So there could be a strong Moonraker trend opportunity in the coming days.
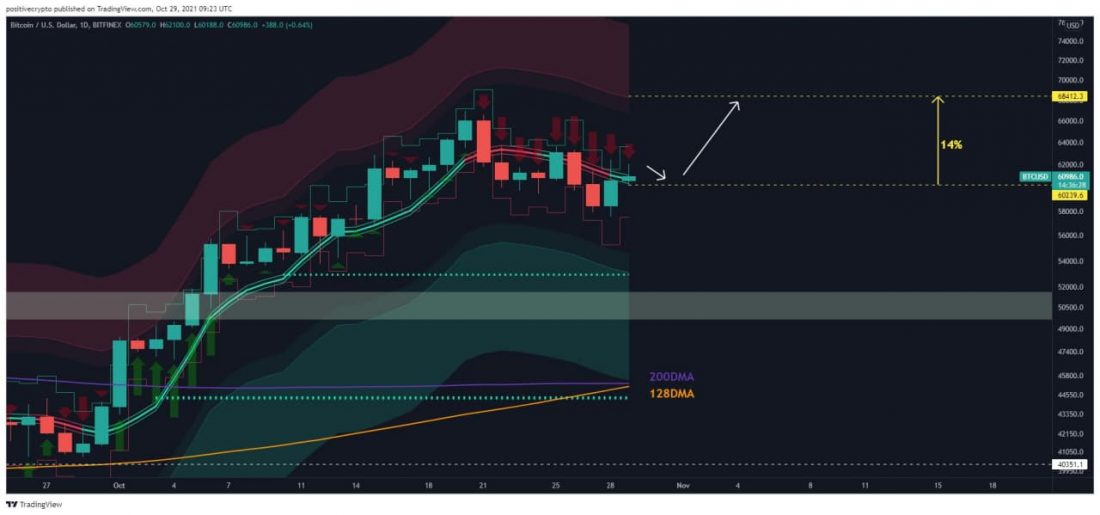
Fig 4: Moonraker setting up for a potential long trade opportunity.
You can learn more about Moonraker and its trading strategies HERE.
Cross-time frame review
We currently have a mixed cross-time frame viewpoint in terms of trend for Bitcoin. Predator, a trend-based trading system is highlighting that $BTC is attempting to continue its high-time-frame bullish uptrend after the weak performance over the past ten days.

Fig 5: Predator cross-timeframes.
Breaking down the indicator across the various timeframes provides the following outlook:
- 1hr: Bullish
- 4hr: Bullish
- 12hr: Bearish
- 1D: Bearish
- 3D: Bullish
- 1W: Neutral
At Decentrader we give particular importance and weight to the 3day timeframe which has been extremely effective throughout Bitcoin’s price history.
Currently, the 3-day Predator algorithm is green so we continue to believe that the bullish uptrend is not broken and expect it to continue until we see evidence to the contrary.
Zooming Out
Zooming out allows us to see just how effective the 3-day Predator indicator has been from the point of view of playing Bitcoin’s volatile trends over time.
When we overlay the Logarithmic Growth Curve over 3-day Predator, it highlights that Bitcoin has now come back and retested a critical level. The mid-point of the Log Growth Curve is rising but currently sits at $57,500, the level where $BTC price bounced yesterday. Should this support hold then we could see the price of Bitcoin accelerate going into the late part of 2021 and potentially early into 2022.
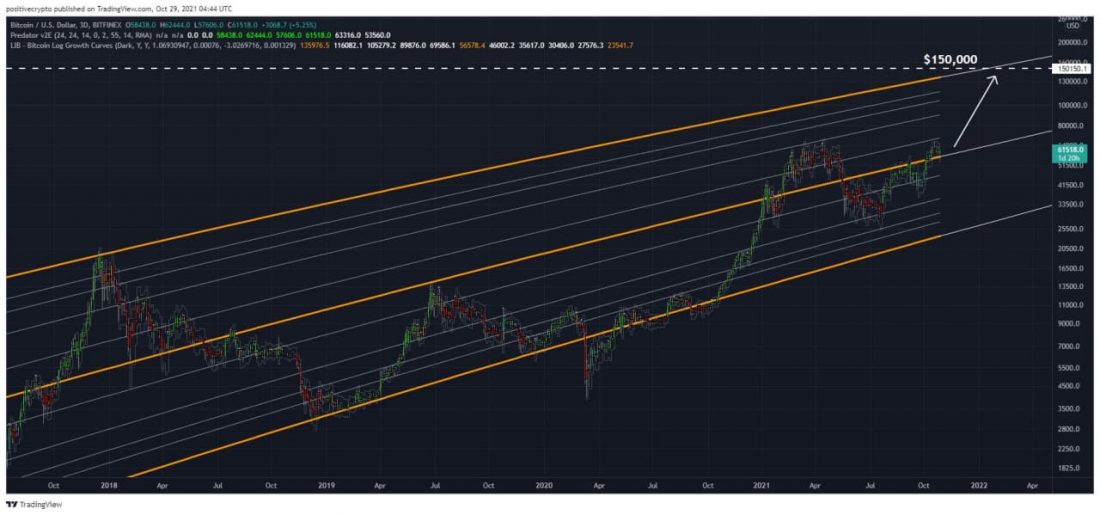
Fig 6: $BTC has now broken above and retested the mid-point of the Log Growth Curve.
Caution should be advised when using the Log Growth Curve as it is merely a mathematical formula based on historical price action to indicate where future price growth may travel. Unlike many other live chart indicators, it is not based on current live market participant behavior. With that caveat in mind, it is still a useful tool that can highlight broad growth direction and historical price has followed key levels of the Log Growth Chart very accurately, with just one clear exception being the Black Swan event of the March 2020 Covid Crash.
Shortly after that event, price rallied back into the Log Growth Curve bands where it has remained since. Not only that, but we continue to see price use key levels within the bands as support and resistance. Given the evidence discussed elsewhere in this report, we continue to believe that the current market trend is bullish. Therefore, we expect there to be a higher probability than not that the mid-point of the Log Growth Curve will hold. Should it do so then it does open up the probability of a strong move up towards the upper orange band level as we head into year end. Currently that level is at $137,000 but is rising fast. By the end of the year, it is likely to be around $150,000.
Balance On Exchanges Continues To Drop
Evidence continues to suggest that existing market participants remain bullish. One data point to support this is the continual draining of Bitcoin from exchanges as users select to put their Bitcoin into cold storage. The net impact of this is that short-term supply is reduced. Until this trend changes it will continue to put upward pressure on price as demand for Bitcoin has to accept higher prices amongst the limited supply available.
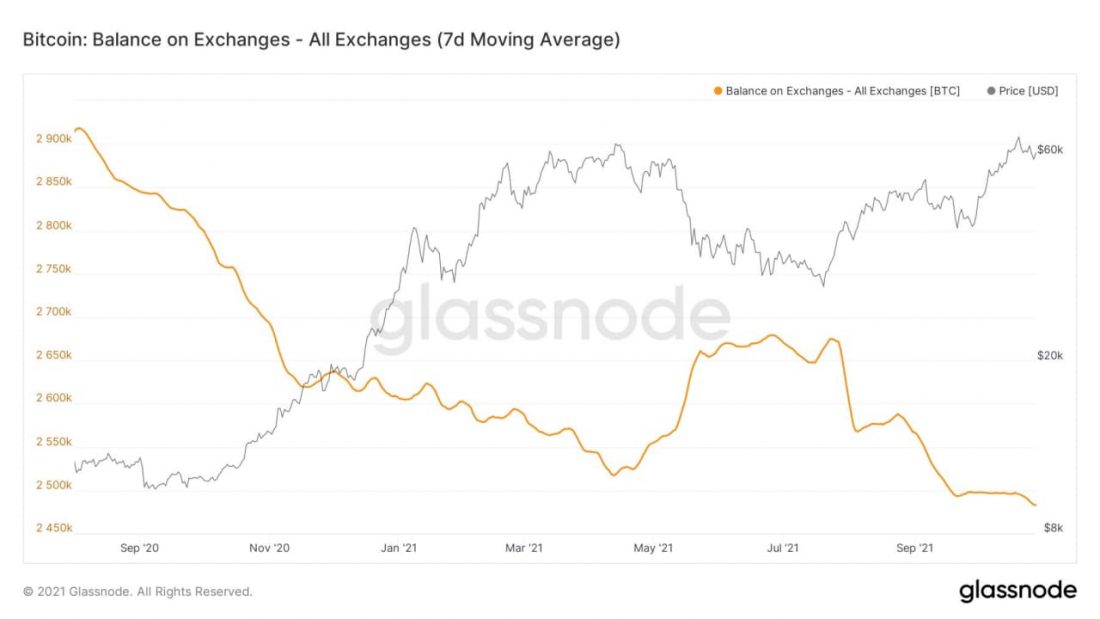
Fig 7: Bitcoin balance on exchanges continues to drop, thereby reducing short term supply.
The ETHBTC Battle Continues
Since the middle of May, ETHBTC has been range-bound on weekly timeframes as it has wrestled with the upper level of the accumulation funnel, trying to use it as support.
After a couple of weeks below it, ETHBTC has now rallied to the upside and is attempting to reach the top of the six-month range up at 0.08.
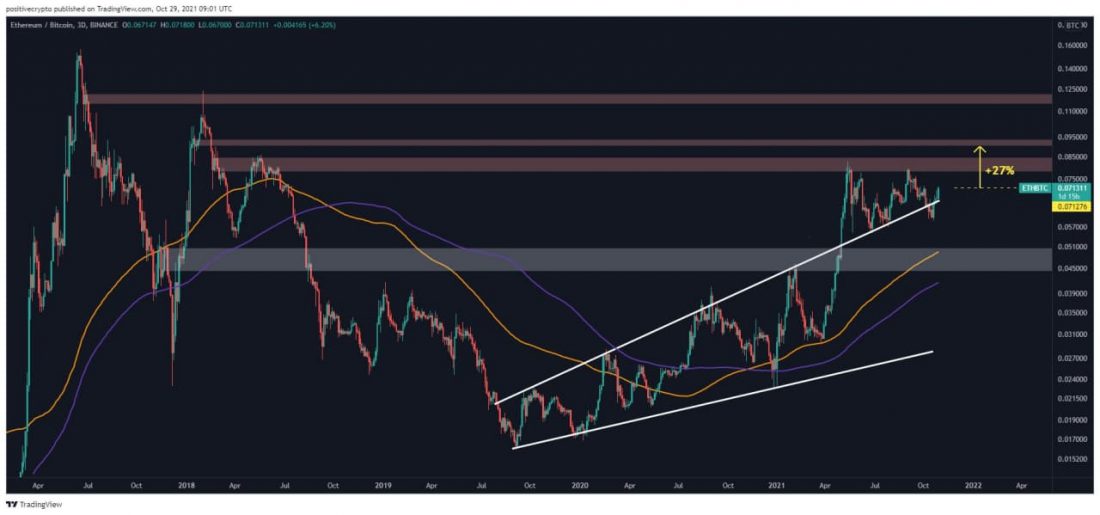
Fig 8: ETHBTC rallying above the accumulation funnel.
Should the accumulation funnel schematic play out then we could see ETHBTC reach up to at least the middle point resistance at 0.091. That would be a +27% potential move from current price levels. Such a move would also likely result in a strong altcoin rally going into the new year.
Altcoin Opportunities Identified By Commando
As the crypto market continues to grow at an incredible rate, the ability to work through hundreds of crypto-asset charts can be very time-consuming. At Decentrader we utilize the Commando indicator to do the heavy lifting for us and highlight key altcoin trade opportunities every four hours.
Commando is a machine-learning algorithm that helps identify leading opportunities in the market for over 100 crypto assets.
Using millions of data points, it cuts through the noise to highlight opportunities and present them in a simple and visual way.
Commando users at Decentrader have been able to take advantage of this in recent months. One recent example being Polygon (Matic) which after printing a 2 score (green bar) on Oct 25th, has since gone on to rally +24% at time of writing with a high of +41%.
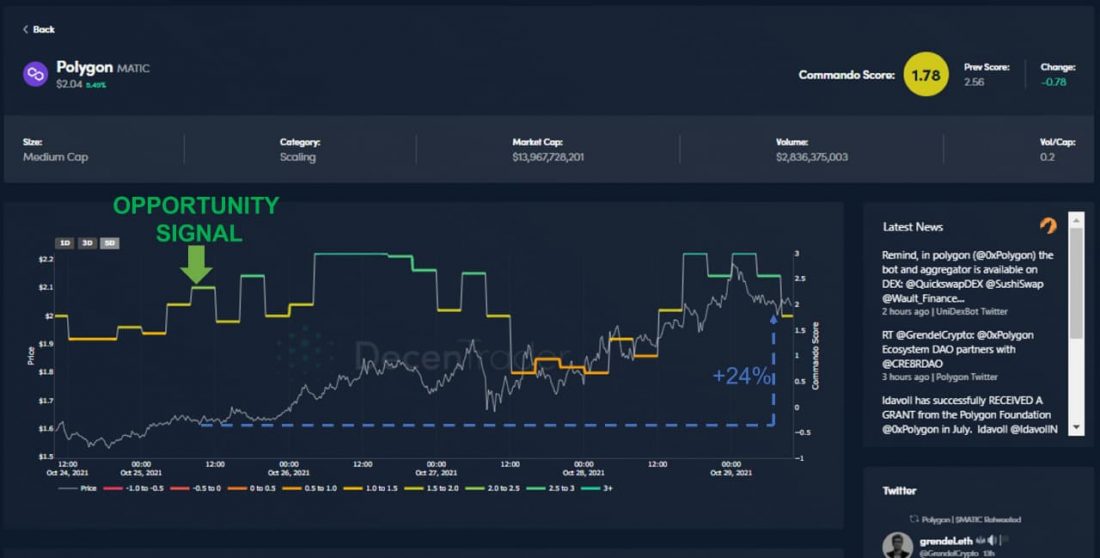
Fig 9: Commando printing a 2 score and resulting in a profitable trade opportunity of +24%
You can learn more about Commando and its trade opportunities HERE.
If Bitcoin can hold the current support level and steadily climb up, then Commando is likely to be firing off many trade opportunities as we head into the weekend.
Happy trading and speak soon.
The Decentrader Team.
Disclaimer: Nothing within this article should be misconstrued as financial advice. The financial techniques described herein are for educational purposes only. Any financial positions you take on the market are at your own risk and own reward. If you need financial advice or further advice in general, it is recommended that you identify a relevantly qualified individual in your Jurisdiction who can advise you accordingly.


