What happens if Bitcoin breaks $30k?
Bitcoin has now spent the past six weeks hovering around the $30,000 level.
In previous market updates we explored why this would be a difficult area of resistance to break through. Notably, due to it marking the lows of the June 2021 crash.
That is certainly proving to be the case after Bitcoin’s 100% rally up from the lows at the start of the year.
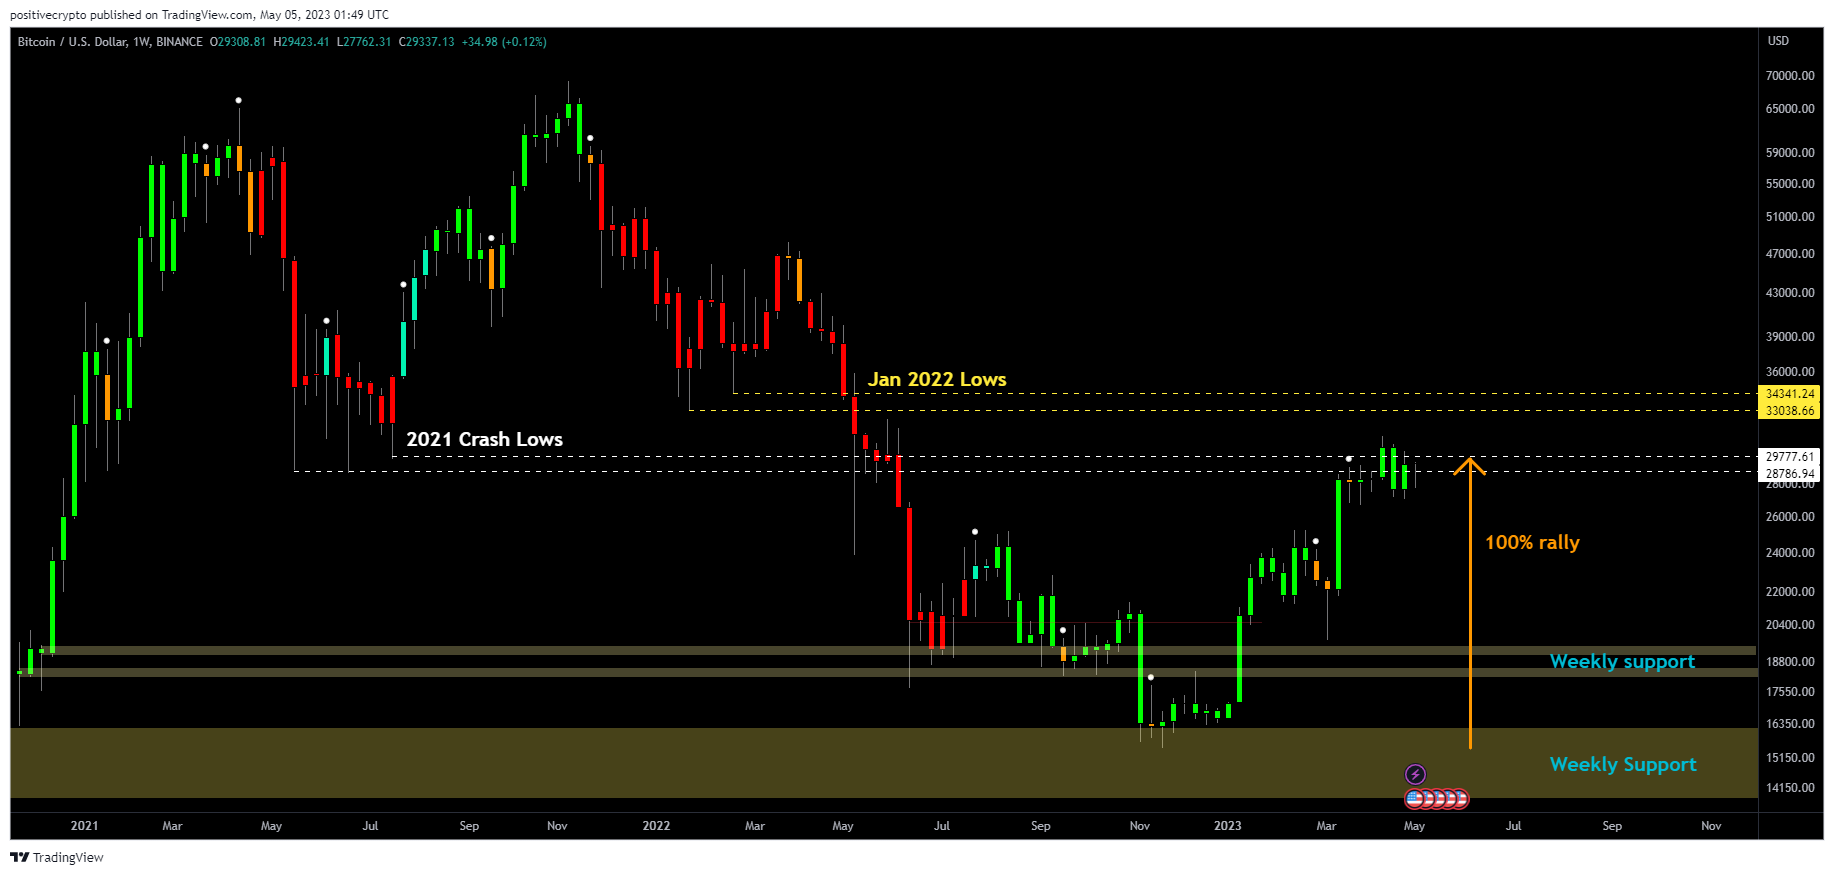 Figure 1: Bitcoin’s upward move has now stalled at major resistance.
We do note that for now at least, Predator indicator remains green on the weekly timeframe as price pushes up against this area of resistance. Suggesting that the trend remains bullish.
Bull market
Although Bitcoin price is struggling at this level, it has managed to reclaim its 1 year moving average, which historically signifies the start of a new bull run.
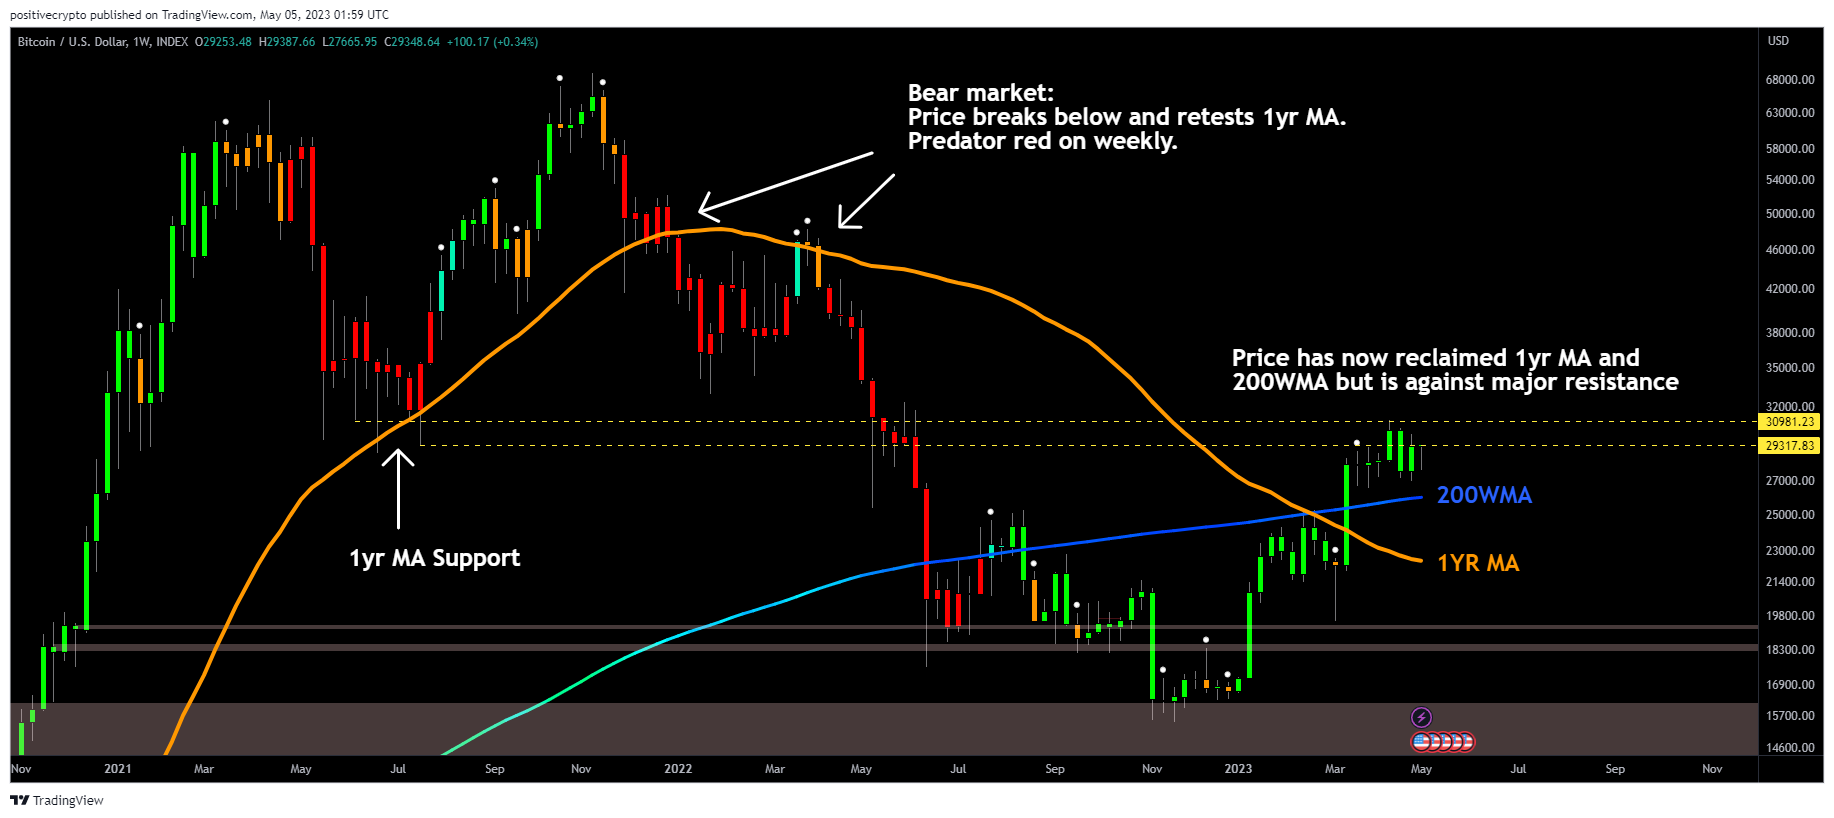
Figure 2: Price reclaims the 1yr MA and 200WMA.
$BTC has also reclaimed its 200 week moving average.
The period below the 200WMA in the second half of 2022 was where any remaining weak hands were shaken out and forced selling from institutions such as FTX took place.
A reclaim of the 200WMA is therefore very important for positive market sentiment…which is a basic requirement for a new bull run.
Liquidity
Should price break through $30k, there is a lot of liquidity between $31,000 – $35,000.
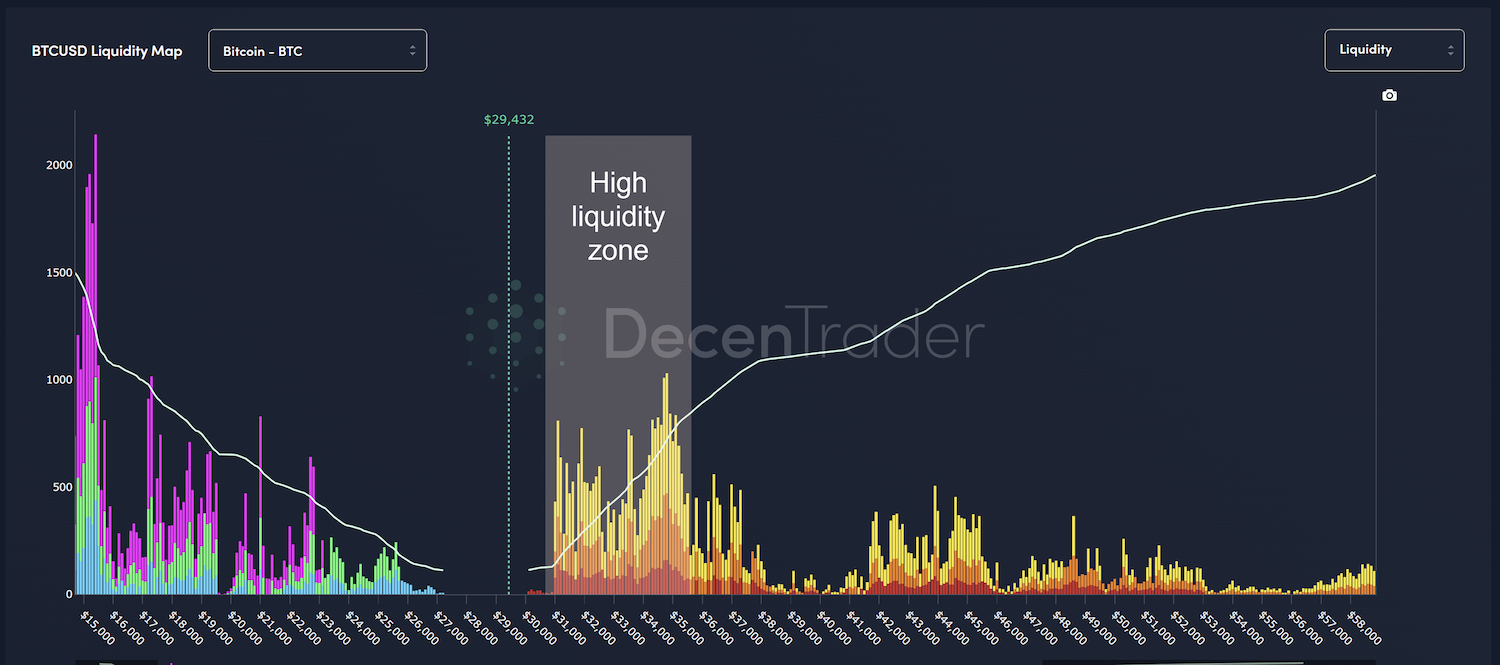
Figure 3: Bitcoin Liquidity Map.
This suggests that price could move quickly through that zone as there may be a lot of 3x, 5x, 10x short liquidations at these prices that could help push price further up, if they are liquidated.
However, it is also worth remembering that whales can use such liquidity to get filled with minimal slippage, so there is also a risk of large asks getting filled around that area.
To the downside there is no significant long liquidity until we drop below $26,000…which interestingly is where the 200WMA is currently sitting.
You can view this Bitcoin Liquidity Map for free over at DecenTrader.
Resistance and support
If Bitcoin can break through the current resistance level and run through the liquidity mentioned above, there is major resistance at $37,000. That resistance is highlighted by Moonraker resistance lines, the red dotted lines on the chart below.
It also marks the point of breakdown market panic from May 2022. When price eventually gets back to that level it would not be surprising to see some profit taking, as underwater traders / investors look to get out around their break-even points.
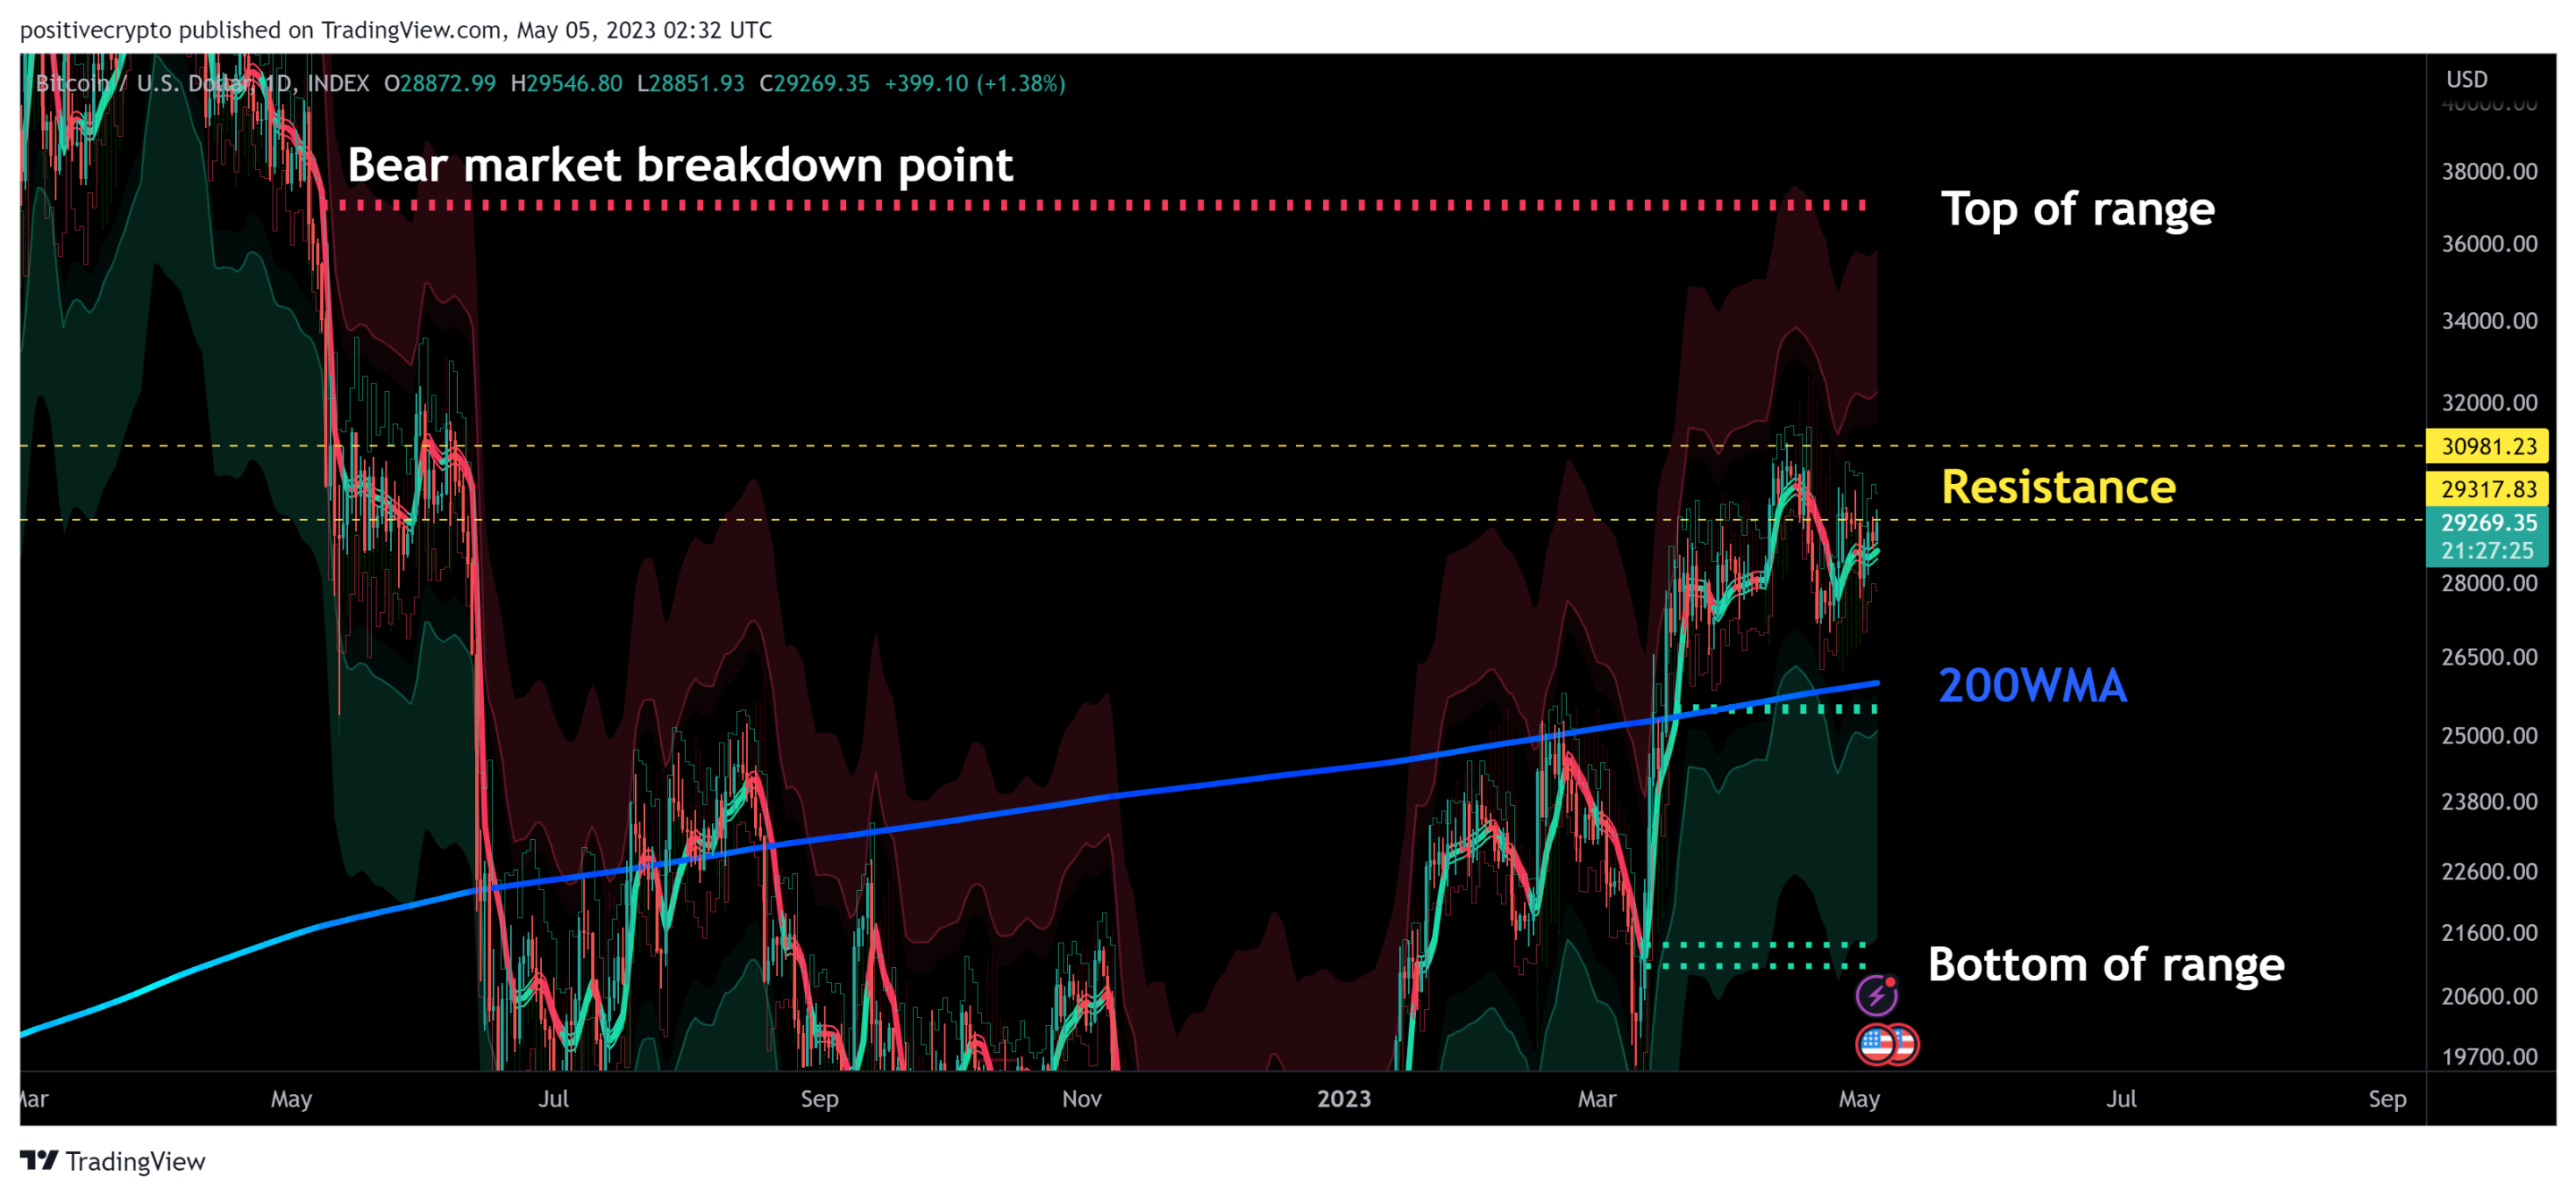 Figure 4: High time frame range for Bitcoin for Q2/Q3.
To the downside, the 200WMA ($26,000) is now trending above Moonraker support at $25,4800. That would likely prove to be some kind of initial support should the price of Bitcoin drop down to that area.
Beyond that is the bottom of the high time frame range with Moonraker support at $21,380.
Ranging early in the cycle
Bitcoin may need to spend some time in this range for the coming months in part due to the market structure mentioned above, but also due to the fundamentals of where we are in Bitcoin’s market cycle.
At this stage of the cycle it is common to see some older coins moving on chain as long term holders, who can act as a proxy for ‘smart money’ start to move their coins. The psychology around this being that they have weathered the storm of the bear market lows and now want to take some funds out of the market following the initial price recovery.
When that happens the Value Days Destroyed (VDD) indicator increases. Those increases are shown by the orange spikes on the chart, following a period of green which represents relatively fewer older coins moving on-chain during the bear market lows.
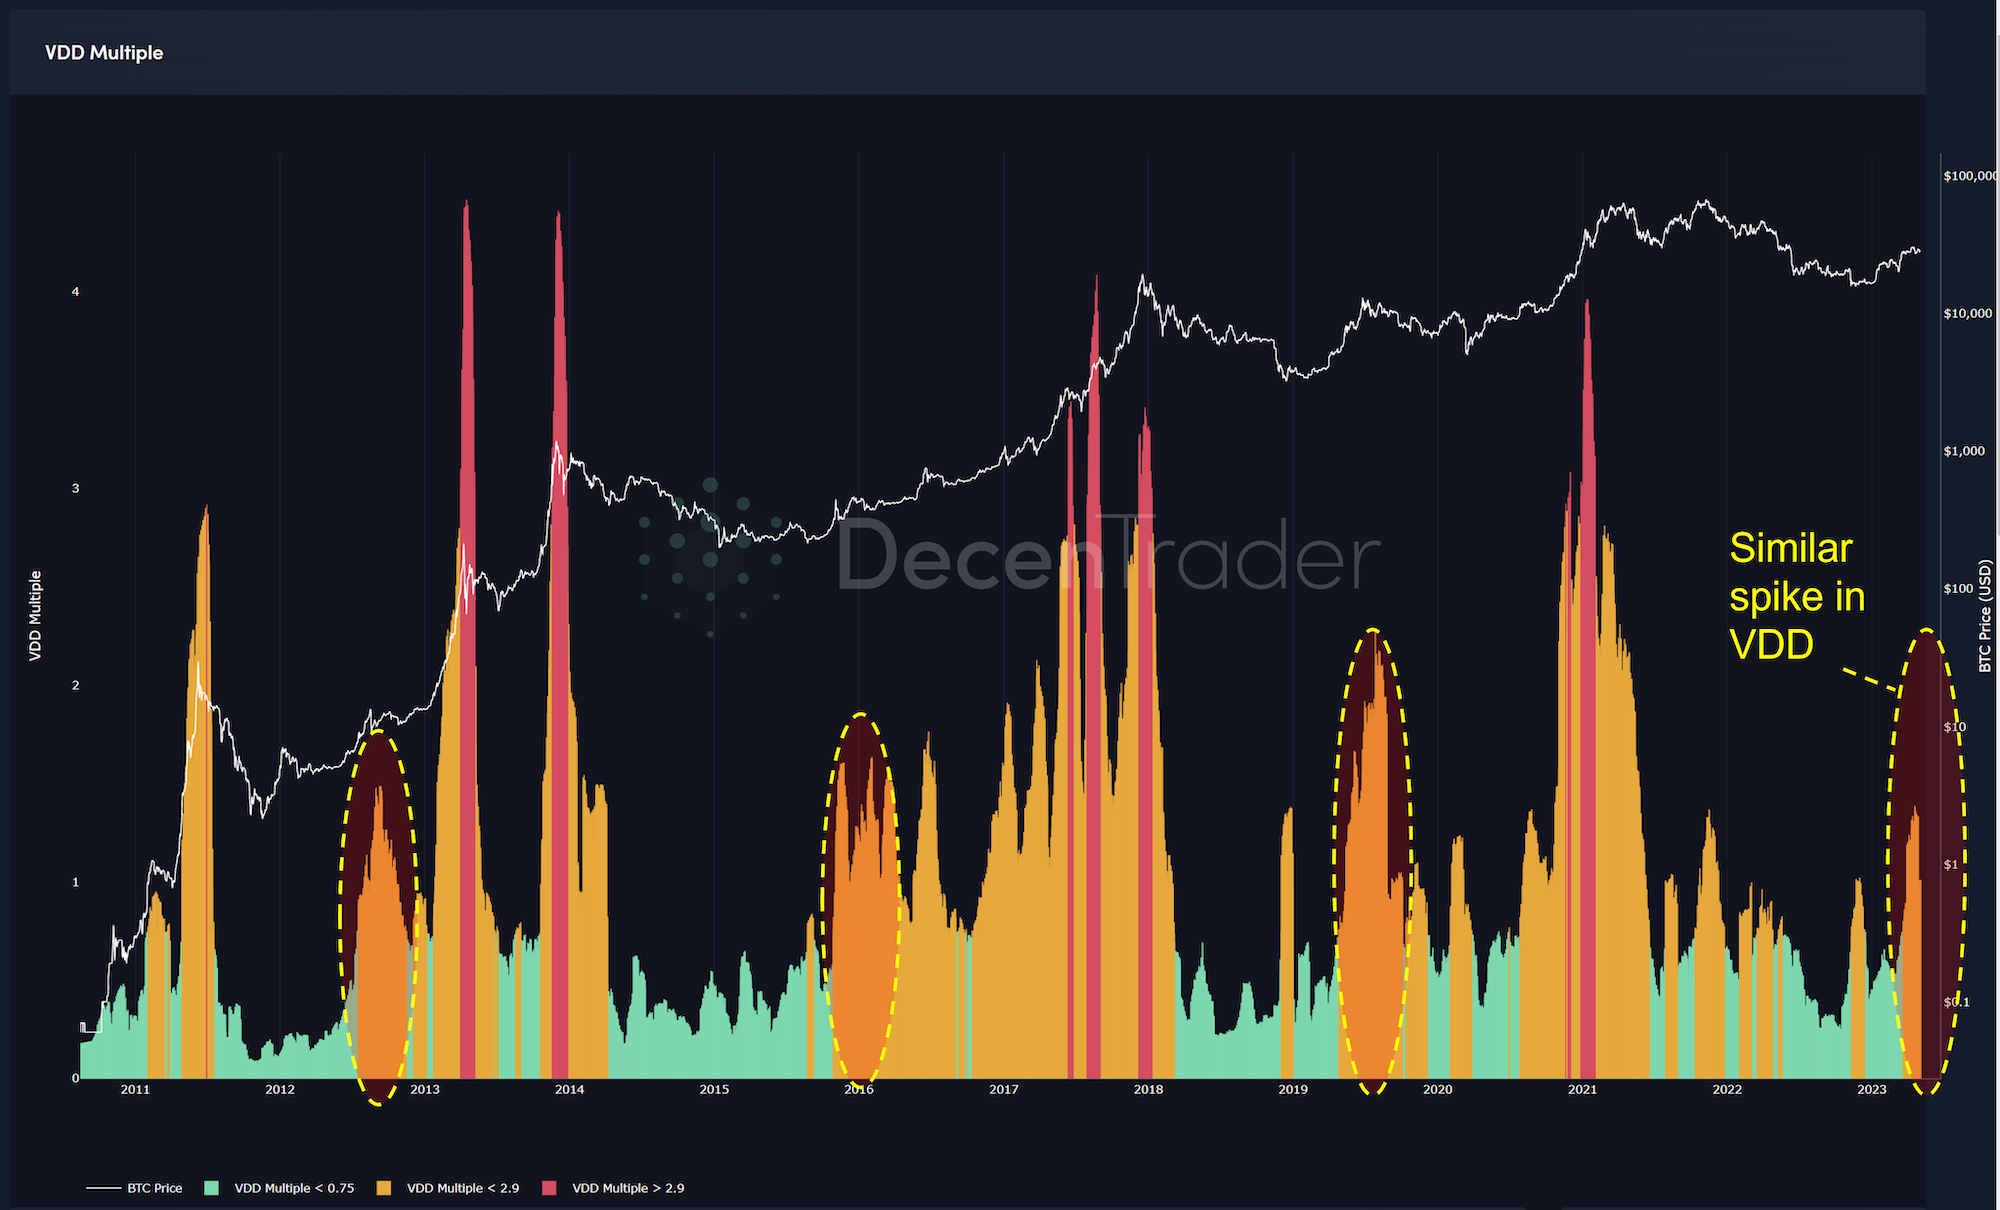
Figure 5: A recent spike in value days destroyed is comparable to previous cycles.
This indicates that some profit taking is happening with older coins as we move out of the bear market.
In prior cycles, as this process unfolds over the course of a few months, Bitcoin price remains range bound. Increased demand is met with this supply from market participants who have held during the bear market. It is possible we will need to see something similar play out again over the next few months.
Conclusion
Bitcoin continues to struggle to meaningfully break through the $30,000 resistance level. If it does break through it could quite quickly move through a lot of liquidity that runs from $31,000 – $35,000. However, there is evidence that around those levels price would also run into tough resistance. Based on prior cycle’s, Bitcoin may need more time to broadly range before any potential aggressive moves towards previous all-time-highs are attempted. Though with strong support levels down towards $20,000 it is likely that pullbacks will be relatively limited and 2022 Q4’s lows will hold.
Disclaimer: Nothing within this article should be misconstrued as financial advice. The financial techniques described herein are for educational purposes only. Any financial positions you take on the market are at your own risk and own reward. If you need financial advice or further advice in general, it is recommended that you identify a relevantly qualified individual in your Jurisdiction who can advise you accordingly.


